Tron has seen a small price increase totalling +2.83% over the past 24 hours of trading. The cryptocurrency is currently exchanging hands at a price of $0.0246 (at the time of writing) after gaining a further 10.65% price increase over the past 7 trading days.
Tron has been under fire recently after misleading people into believing of a major upcoming partnership. A few days ago, a rumour was floating around that Tron will be partnering with the Chinese search engine giant known as Baidu. As China sits behind a great firewall, many search results are censored by the Chinese government and therefore cryptocurrencies are suppressed in search results.
However, the rumour has been recently falsified as the partnership that was announced was simply the purchase of cloud computing for Tron from Baidu Cloud Storage. The markets have not responded particularly negatively to the announcement but many investors may be feeling alienated by Justin Sun at this moment in time.
Tron is currently ranked in 11th position in terms of overall market cap across the entire industry. It currently has a total market cap value of $1.62 billion after seeing a 27% price increase over the past 30 trading days. The 13 month old coin is still trading at a price that is 90% lower than its all time high value.
Let us continue to analyse price action for TRX/USD over the short term and highlight any potential support and resistance areas.
Price Analysis
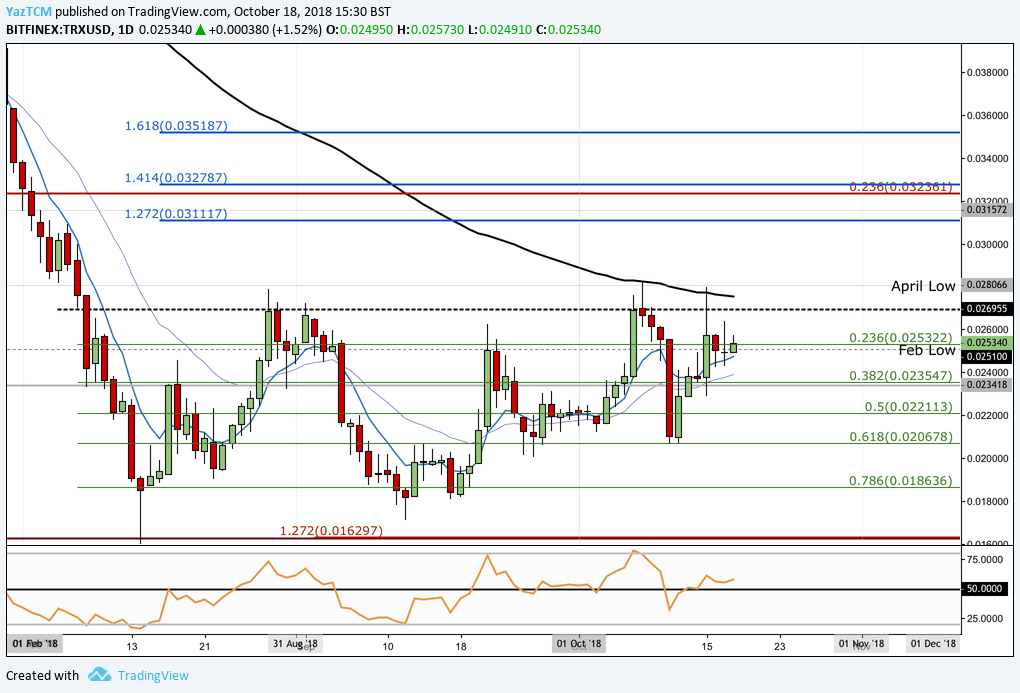
TRX/USD – SHORT TERM – DAILY CHART
https://www.tradingview.com/x/NIp6qOte/

Analysing price action from the short term perspective above, we can see that price action has moved sideways since our last Tron analysis article. Price action had experienced a bullish run when the market started at a low of $0.016 on the 14th of August 2018 and extended to a high of $0.02787 on the 28th of August 2018. This was a price increase totalling 70% from low to high.
We can see that as price action reached the high, it had met resistance which was provided by at the $0.02696 handle. After reaching the resistance, price action rolled over and began to decline until finding support at the short term .786 Fibonacci Retracement level (drawn in green) priced at $0.018636. Price action then rebounded and continued to rally again.
The market is now currently trading at the support provided by the .235 Fibonacci Retracement level priced at $0.2532, if the bulls can continue with their bullish momentum and push the market higher we can expect resistance above at the $0.026955. If they can continue further beyond this resistance level then we can expect more resistance at the April 2018 Low price at $0.02806.
If the bulls can continue to clear the April 2018 low price then we can expect higher resistance at the short term 1.272 Fibonacci Extension level (drawn in blue) priced at $0.0311 followed by the short term bearish .236 Fibonacci Retracement level (drawn in red) priced at $0.032361. If the bulls continue further higher then even more resistance can be expected at the 1.414 and 1.618 Fibonacci Extension levels (drawn in blue) priced at $0.032 and $0.035, respectively.
Alternatively, if the bears regather momentum and push price action lower we can expect immediate significant support below to be located at the short term .382 Fibonacci Retracement level priced at $0.0235 followed by the .618 Fibonacci Retracement level priced at $0.02067.
If the bears can continue to pressure price action further lower then we can expect ever more support below at the .786 Fibonacci Retracement level priced at $0.01863 followed by the downside 1.272 Fibonacci Extension level (drawn in red) priced at $0.016297.
The RSI technical indicator has recently broken above the 50 handle indicating that the bulls are in control of the momentum within the market. If the RSI can remain above the 50 handle we can expect this market to continue to make further gains.


