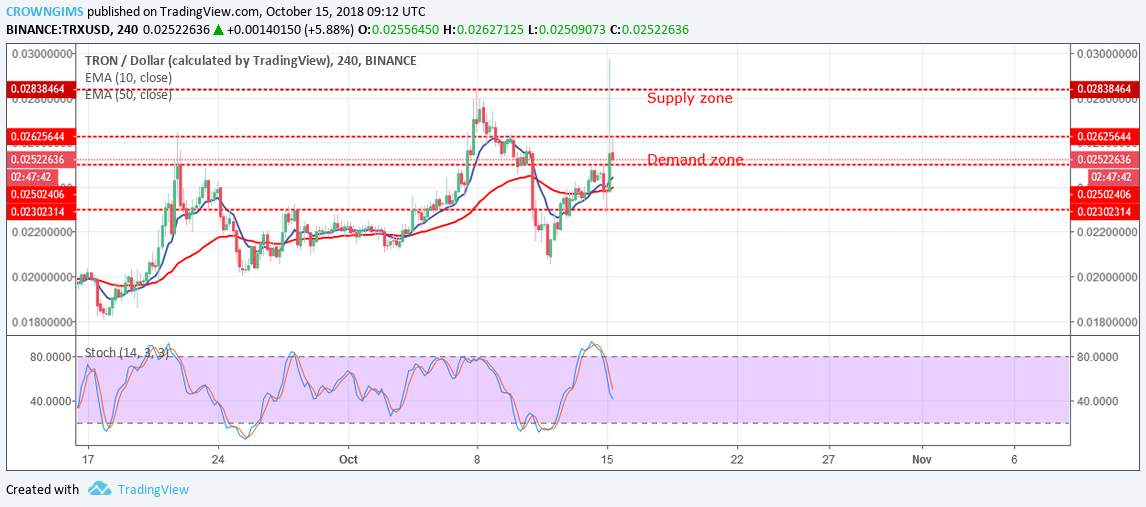
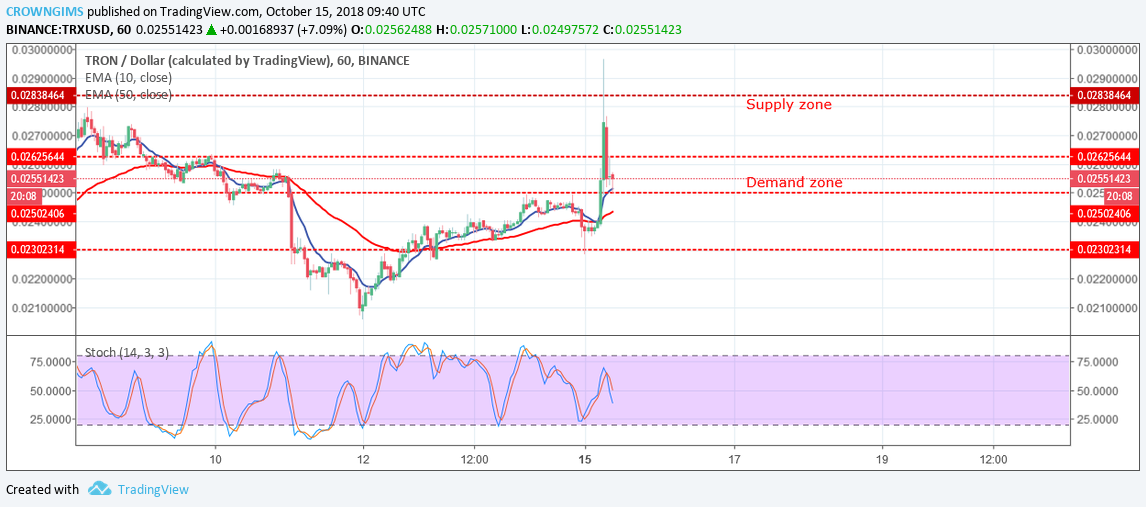
Supply zones: $0.026, $0.028, $0.030
Demand zones: $0.025, $0.023, $0.020
TRX/USD Medium-term Trend: Bullish

The cryptocurrency continues its bullish movement in its medium-term outlook. On the October 12, TRX returned to the uptrend movement as the bears lost pressure and were not able to push TRX beyond the lower demand zone of $0.020. The bulls took over the market. Yesterday, there was a pullback as the bears pushed the coin from the former supply zone of $0.025 to the demand zone of $0.023.
Today, more buyers entered the market with their momentum and the price was pushed to the supply zone of $0.030 before the sellers return with increased momentum and pushed it back to retest the demand zone of $0.025.The bears’ return was confirmed by an upper long-tailed bullish candle.
TRX is above the 10-day EMA and 50-day EMA with the stochastic oscillator 14 above 40 levels and its signal lines point down, thus signaling a downward movement as it may be a price retracement before it resumes its uptrend movement.
TRX/USD Short-term Trend: Bullish

Earlier today, the price was bearish moved to the demand zone of $0.023 on the short-term, it was rejected by the formation of bullish pin bar which indicates the return of the bulls to the market.
The cryptocurrency enters sudden uptrend movement which confirmed the increased momentum of the bulls. It broke the supply zone of $0.028 upside, after which the market experienced a bearish movement.
Currently, the price is on the dynamic support of 10-day EMA and the 50-day EMA below it. In case the bears increase their pressure and break the demand zone of $0.025 downside the price will be exposed to the lower demand zone of $0.023. The Stochastic Oscillator is below 50 levels with its signal lines point to the south which indicates a sell signal


