
 Technical Analysis #001 - Trading within a long term symmetrical triangle")
Ethereum has has a troublesome year with regards to its price, falling from a high of $1,285 set in early January, to a low of $398 set on the first trading day of April. This is a significant 75% reduction in price from low to high.
Over the past few days, ETH has shown a slight rebound in price against the USD and is currently exchanging hands at a price of $608, at the time of writing.
Over the course of the year Ethereum, the open software platform created by Vitalik Buterin that allows developers to build decentralised application (DAPPS), has experienced some issues with the scalability of its Blockchain.
However, the issue of scalability may soon be put to rest as Vitalik recently made some comments on the issue. Buterin stated that with a new development known as Sharding, Ethereum’s blockchain will be able to hand up to tens of thousands of transactions per second. This is a significant step up from the 25 per second they are currently able to achieve right now.
If this new upgrade to the protocol can prove to improve the throughput within the Ethereum blockchain then we may see a significantly increased number of bulls beginning to step within the market.
ETH/USD Price Analysis
ETH/USD – Daily Chart – Long Term
https://www.tradingview.com/x/EVqx1L1N/
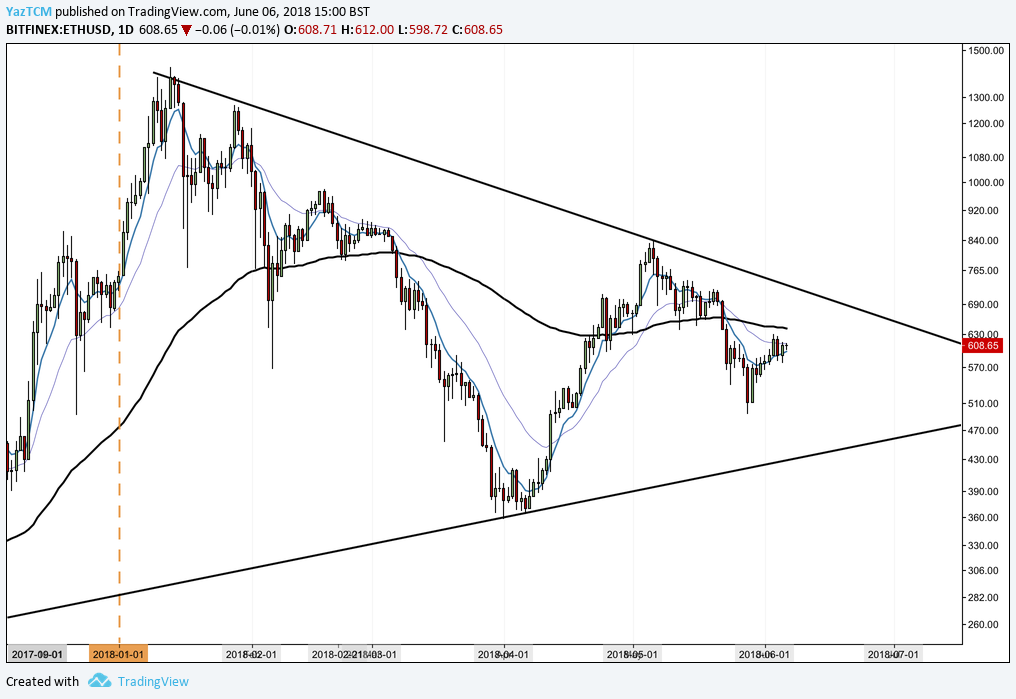
Analysing the chart from a long term perspective, we can see that Ethereum has largely been trading, throughout the year current year, within the confines of the symmetrical triangle highlighted in the chart above. This means that ETH is not trading in a bullish nor a bearish market trading condition.
Price action is currently trading below the 100-day SMA at $606, but it is showing some promising signs to make a recovery. We can Ethereum is trading significantly higher than the lows for the year, set out in early April at a price of $398. In fact, ETH is trading approximately at an increased price of 66% from the lows.
For the market to be considered a bullish market we would first like to see a break above the upper boundary of the symmetrical triangle before price action goes on to test the highs set in early May at a price of $838. Judging from the chart, it is quite possible for price action to be able to attempt to break the upper boundary of the triangle at some point within the month of June.
Alternatively, if price action fails to hold above the $600 level, then we may see price fall and head toward the lower boundary of the triangle. In this case, June would turn out to be a pretty solemn month for Ethereum bulls.
ETH/USD – Daily Chart – Short Term
https://www.tradingview.com/x/YMTJnoWy/
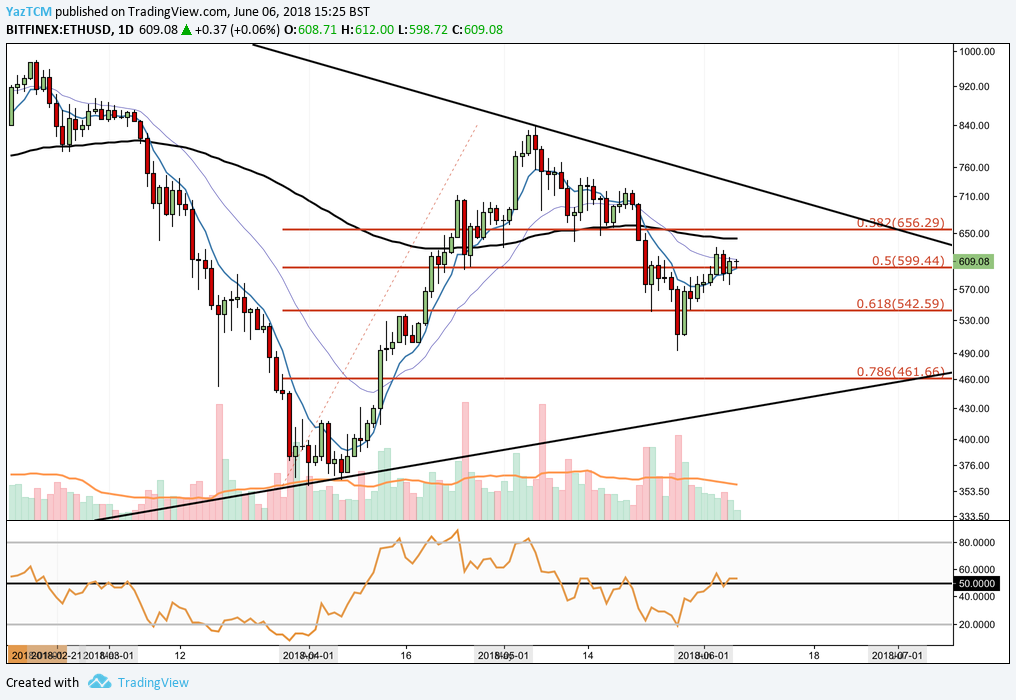
Analysing the chart from a short term perspective, we can see that Ethereum has retracted all the way past the .618 Fibonacci Retracement located at $524. Price action did not stay below this level for long and swiftly rebounded back above a day later.
This Fibonacci Retracement is a retracement of the bullish run seen during the month of April. Ethereum is currently trading around the .50 Fibonacci Retracement at a price close to $600, at the time of writing.
Price action has been showing some promising sings in the past week of trading. If it can find enough support and stay above the $600 level then we could expect to see price action make an attempt to break out of the long term symmetrical triangle that Ethereum has been trading within for some months.
Following a break of the triangle toward the upside, we may see price action continue and make another attempt to see the resistance experienced in early May at a high of $838.
Alternatively, if Ethereum fails to hold above $600, we may see it drop further as it would make it way down further toward the $542 level once again.
The technical indicators are showing some promising signs for Ethereum bulls. The RSI has managed to move from oversold territory and battle its way above the 50 handle indicating that bullish momentum within the market may be increasing.
For a bullish run to continue, we would like to see RSI stay well above the 50 handle. The 7-day EMA and 21-day EMA are also showing signs of crossing one another which would aid to the bullish momentum within the market.
Conclusion
Like most cryptocurrencies, Ethereum is trading within a range bound/consolidating market. June will be a telling month for the cryptocurrency from a technical perspective as major long term consolidation trading patterns may be resolved.
From a development perspective, the recent announcement by Vitalik shows regarding Sharding provides hope that the long term problem of scalability may finally be showing signs that a resolution may be near.


