
 Technical Analysis #003 -Can TRX Hold the .618 Fibonacci Retracement Against the Dollar_")
Tron has suffered further blows this week as bears drag price lower by up to 19% over the past 7-days, at the time of writing. Prices had started the week at $0.07 but have since significantly fallen to $0.056.
We will be watching to see if TRX can hold major Fibonacci Retracement levels against the dollar. More specifically, the .618 Fibonacci Retracement located at $0.056.
With the mainnet launched and and the team working hard, can Forbes 30 under 30, Justin Sun, prove the capabilities of Tron and show that it can outshine competition such as Ethereum?
Overview
TRX/USD – Daily Chart – Long Term
https://www.tradingview.com/x/fkWE0RfX/

From the chart above, we can see that price action has continued to return more of the gains seen in April as the markets approach the .618 Fibonacci Retracement. We have been following the development of price action in relation to this Fibonacci Retracement for the past few trading sessions and it has proven to show its validity.
With TRX falling to the .618 Fibonacci Retracement, priced at $0.056, it will be pivotal to see if price action can find support within this area and maybe start to show signs that it is beginning to reverse.
Technically speaking, a .618 Fibonacci Retracement is said to be the ‘Golden Ratio’ at which most retracements will retrace toward before price may reverse. However, as of recent, most crypto markets tend to retrace to the .786 Fibonacci Retracement before showing signs of reversing, most notably Bitcoin.
If price can hold above $0.056 then we could expect TRX to trade sideways and hopefully make attempts at the previous level of support at $0.0645. For price action to be able to continue further in its bullish manner, we would need to see some strong updates of development from Justin Sun and Tron team.
Alternatively, if price action does not hold the .618 Fibonacci Retracement then we may see the market fall to our next identified level of support at $0.047. It would be a rough start to the month for TRX if we were to see prices dip so low.
The technical indicators are not helping in showing positive signs for the bulls. The RSI is has been under 50 for quite some time now and is only slowly approaching oversold conditions. The 7-day EMA has crossed below the 21-day EMA indicating that the downward momentum may continue. However, price has managed to find a level of support on the 100-day SMA. This level may prove to be a significant level of support for price.
TRX/USD – 4-Hr Chart –
https://www.tradingview.com/x/ZthSvsSE/
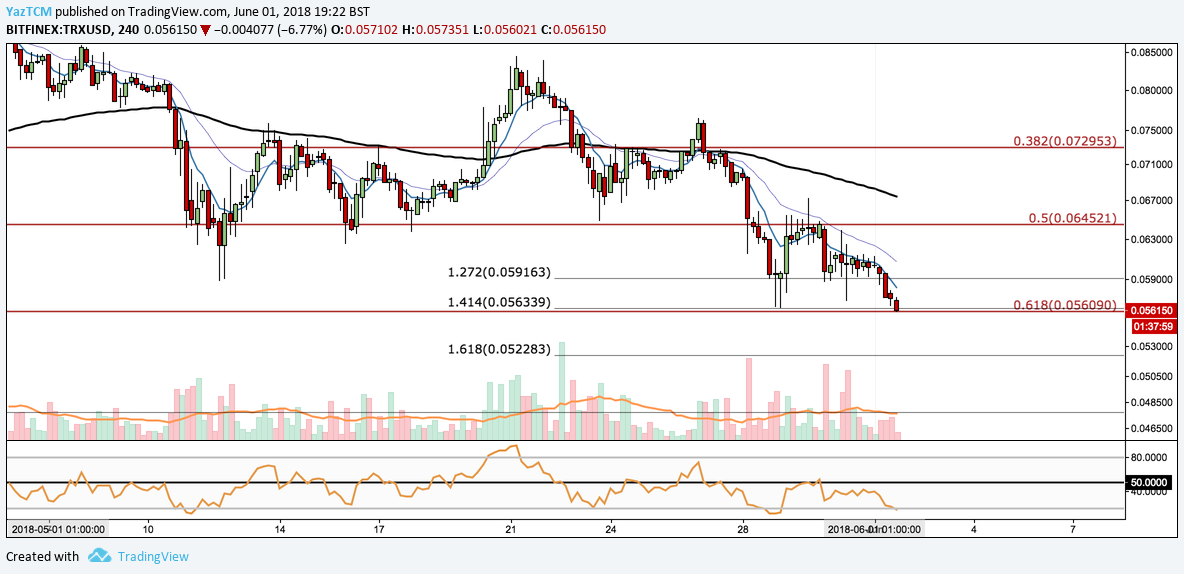
We can see that tron has returned to retest our support level outlined in our last TRX update here. The .618 Fibonacci Retracement has proven to provide significant support in the previous few trading days but can it continue to hold?
If price action manages to dip below the .618 at $0.056 then we may see TRX drop against the dollar to a price of $0.052 initially. This is the downside 1.618 Fibonacci Extension of the bearish swing leg experienced from May 21 to May 23. Price action may find some stability in this region before going on to retest the .618 Fibonacci Retracement again.
Alternatively, if the .618 Fibonacci Retracement continues to hold then we may see TRX start to eventually appreciate against the USD. In the short-term, if Tron can break above $0.059 we would expect a small bullish run as it attempts to retest previous support marked at $0.064.
With a lot of exciting potential developments in the pipeline, this brief bearish period could prove to be only the beginning of a bright few years for Trons long-term future.

