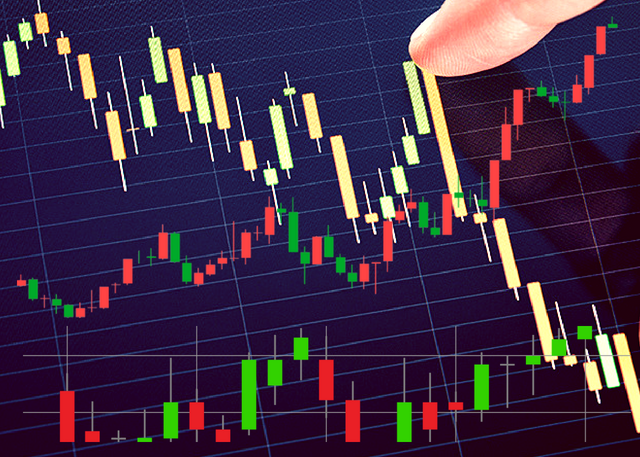
Why is so much emphasis given to using “Trading Indicators and Charts” while dealing with cryptocurrency? Isn’t buying them at a fair price and then selling at a profitable price enough? The answer is “No”.
As you know the cryptocurrencies are in limited quantity. They cannot be printed as much as you want, like our regular fiat currencies. For example, the limit on bitcoin is 21 million and that on Ethereum is approximately 100 million.
Just like BTC and ETH, every other cryptocurrency (there are 1592 at the time of writing) has the limit cap. Going back to the time where gold was used as a medium of exchange, it can be mined in limited quantities and so it has value. The gold market experiences ups and downs. But the advent of cryptocurrency has made gold investment a side track as the cryptocurrency market is highly volatile than gold. Thus, giving you good returns.
To plan your entry and exit points in this highly volatile crypto market, it is unwise to rely on prediction of others. You got to calculate for yourself as you are risking your own money. This is the point where trading indicators and charts come handy. If you have been trading forex or stocks, it will be easy for you to read the charts and make profitable trading strategies. Because the trading of crypto is similar to that of forex and stocks.
If you are all new to trading, don’t feel sad. You just need to check on some tutorials and learn how to use trading indicators and charts. Now, there are a huge number of them available in the market and a few are included in the exchange through which you trade. At this instant, you will be wondering then which trading indicators and charts to use?
In an online survey conducted by Encrybit, an upcoming improved and secure cryptocurrency exchange, the crypto traders were asked to mention the most appealing trading indicators and charts. And the results are:
Most Popular Trading Indicators
- MACD (Moving Average Convergence-Divergence)
- This trading indicator helps to identify strength, direction, momentum and duration of the trend for a coin’s price. It is one of the most effective momentum indicators.
- SMA (Simple Moving Average)
- Simple as the name suggests, it is basically the average price calculated for the chosen time frame.
- EMA (Exponential Moving Average)
- Another variant of moving average which focuses more on recently changed prices.
- RSI (Relative Strength Index)
- It is a momentum oscillator which measures the change of recent hike and drops over a specific period of time.
- ADX (Average Directional Index)
- The calculation of this indicator is based on the range of moving average price’s expansion for a specific time period. It is used to determine whether a particular trend is strong or weak.
- Stochastics
- As per the name, it is the relation between current prices to its price range for the given period of time. It can help you determine the point of time when the trend will end.
Most Popular Trading Charts
- Line chart
- The most basic type of chart which is used to monitor closing prices. Here, the line connects a series of closing prices over any time period.
- Candlestick chart
- The candlestick represents the open and close of a day’s trading. The regularly occurring patterns helps to predict short-term direction of the price.
- Bar chart
- Again a familiar name and concept similar to that of candlestick (of day trading). It is used to illustrate the movement of price.
These are three popular ones followed by Mountain, Renko and Kagi charts.
Hope your half job is done. Now, you got to learn these indicators and charts and start trading. Wish you good luck!


