
 Technical Analysis #001 - Remains Trapped Within Range Bound Conditions")
Ripple is sitting comfortably in 3rd place, in terms of market cap at the time of writing, with an impressive $24 billion in market cap value. This is an incredible market value for the company that claims their token is the fastest and most scalable digital asset in the world.
Over the past 90 days, Ripple has seen over a 30% reduction in price movement. The token had started the year trading at a price of $3 and has since slowly deteriorated in terms of price to a low around $0.46 set out in April.
Although price may be significantly down, there are technical signs that Ripple may be shaping up for a good few weeks ahead. With upcoming collaborations with major institutions and potential impactful news, it is important not to get complacent with this crypto powerhouse. A significant bullish run can happen at any moment.
Long Term Overview
https://www.tradingview.com/x/ZklUxLRw/
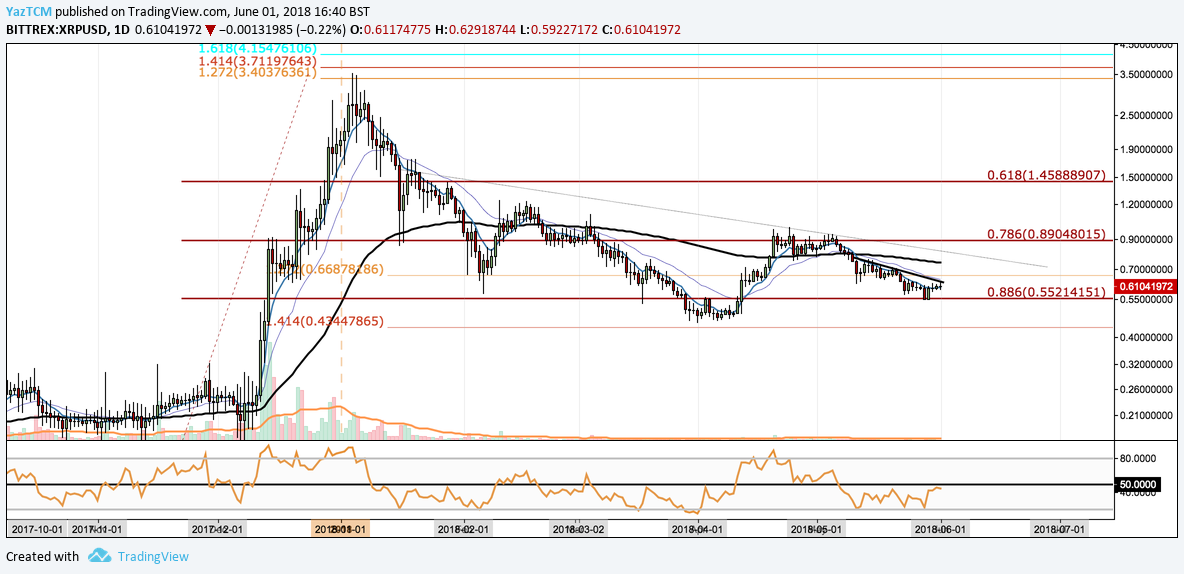
From the charts it is apparent that XRP, the token behind Ripple, has experienced a significant decline from the highs, close to $3, set in January 2018. Since the highs, price has declined just beyond the .886 Fibonacci Retracement level at a price of $0.55. This is a retracement taken from the significant bullish swing that was seen in December 2017.
We can see that April seemed to be a promising month for XRP as the market managed to climb from a low of $0.45 to a high of $0.95. May, however, has proved to be a tough month as markets fell from Aprils highs to a low of $0.55.
We can also see that for the past month, the market has been rangebound between the .786 and .886 Fibonacci Retracement levels, $0.89 and $0.55 respectively. If price manages to break and hold above $0.89, during the month of June, we could expect price to go on to test previous resistance at $1.45.
Alternatively, if price declines and closes below $0.55 we could expect price to make another attempt at the lows seen during April at around the $0.45 handle.
The technical indicators are still showing signs of a bearish market, however, they are showing signs of positivity as they battle to improve. The RSI indicator is approaching the 50 handle, indicating that the previous bear momentum may be fading. We would be looking for a close above the 50 handle for some positive signals in the bulls favour. The 7-day EMA is also attempting to make a cross above the 21-day EMA which would further add confirmation for the bulls to pull the trigger.
Short Term Overview
https://www.tradingview.com/x/2Y0DpXp7/
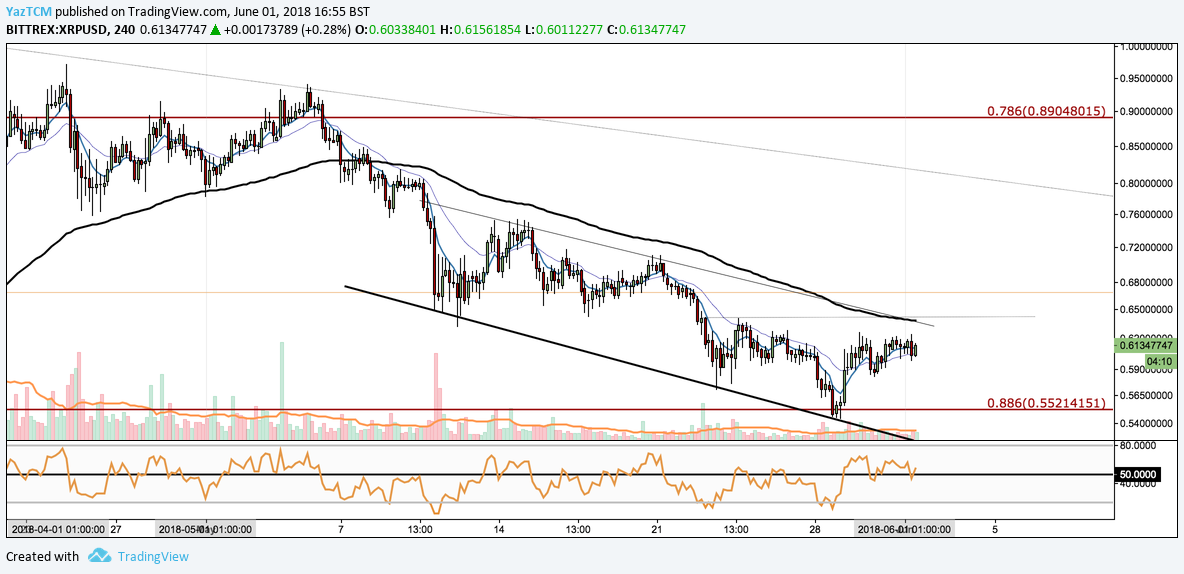
From a short term perspective, XRP has been trading against the dollar within the confines of a descending channel extending from the 14th of May. The pair is currently trading sideways as the market remains patient waiting for traders to show their next move.
If price action can break and hold above $0.63 then the market may experience some further bullish momentum as it continues on to test a major previous support level at a handle of $0.67. Alternatively, we could expect prices to drop further and retest the lows of May at a price of $0.55.
The technical indicators are also showing promising signals for the bulls in the short term. RSI has managed to battle its way up above the 50 handle and has remained along this level for the past few trading sessions. The short term moving averages have also crossed above each other indicating that bullish momentum may be incoming for Ripple.


