
 finds Support at significant Fib Retracement level")
Bitcoin finds support at significant Fib retracement level whilst remaining to trade within a triangle
After a promising month in April, where Bitcoin had experienced some bullish momentum from the lows of $6508 to a high of $9992 set in early May, Bitcoin is now on course to returning the majority of the gains from that bullish run.
Bitcoin has suffered losses of over 5%, throughout the past trading 24hours, as price drops below the $7500 level. This brings the total loss of Bitcoin close to 18% over the past 30 days.
Long Term –
Considering the markets are trading within a bearish trajectory it is important to keep the big picture in mind to remain rational within falling markets.
After experiencing such a bullish run in late 2017 it is understandable why Bitcoin may be consolidating for a short period of time. Although Bitcoin may have fallen significantly in price from the highs of 2018, at the $17230 handle set in early January, it is important to emphasize that the market is in a period of consolidation where neither higher highs or lower lows are being created. This characterised by the formation of a long term symmetrical triangle shown in the chart below.
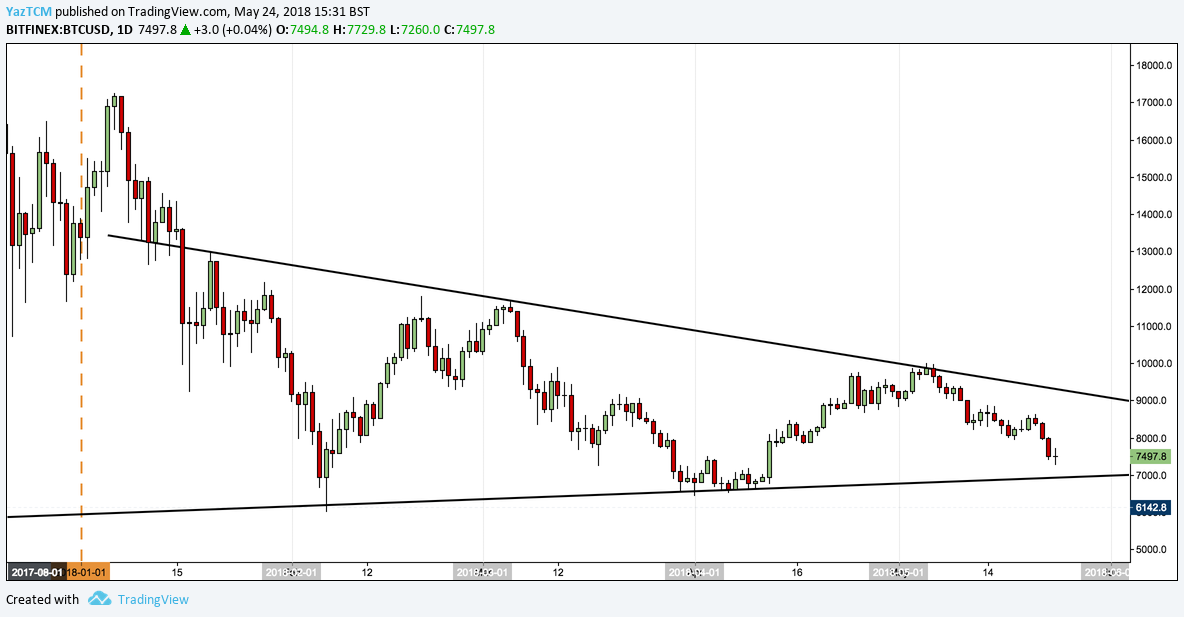
From the chart, we can see that Bitcoin has remained in this long term triangle for a period of almost 5 months after its formation in mid January.
This series of lower highs and higher lows shows that Bitcoin is neither in a bullish or bearish market. Instead, Bitcoin is trading within a consolidating market. For the market, in the long-term, to be considered bearish, Bitcoin would need to break below this years low, set out in February, at around the $6000 handle.
Typically, symmetrical triangles resolve themselves in the direction of the previous trend. In Bitcoins case, this would mean a strong break to the upside. From the analysis on the market we could expect to see the resolution of this triangle during the trading period of either June or early July.
Near Term
May has been a bearish month for Bitcoin, dropping from the highs of $9985 to todays low of $7251 (at the time of writing).
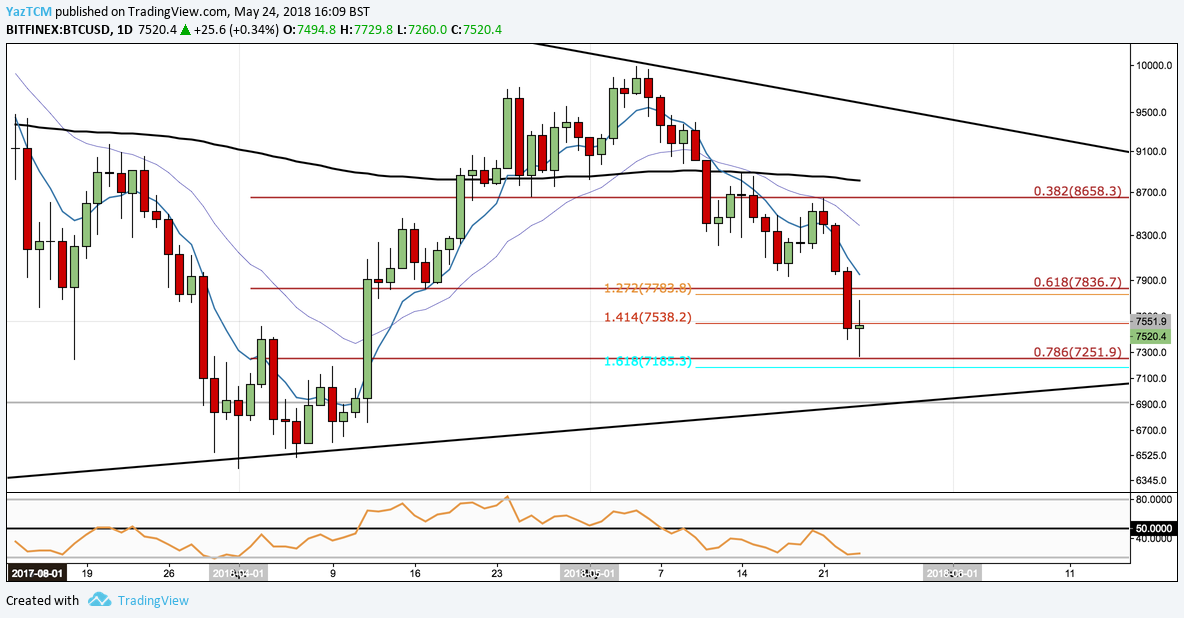
From the chart above we can see that Bitcoin has found support at a significant .786 Fibonacci retracement level. The Fibonacci retracement is a retracement of the previous bullish move experienced in April up until early May. The .786 retracement is located around the $7251 handle and price has already experienced some rejection at this level. However, it is important to note that this fibonacci retracement level is not expected to hold and is to be only viewed as an area where the market can pause momentarily before continuing its downward trajectory.
If price action manages to close below this level on the Daily timeframe then we will expect Bitcoin to continue trading lower until it reaches the lower confinement of the long term triangle previously discussed at a price range of $6900-$7000.
This lower confinement of the triangle also confluences with major Fibonacci extension levels taken from the declines in December and January. More specifically, the 1.414 extension at a price of $6908, taken from December 12th high to December 22nd low and the 1.272 extension at a price of $6915, taken from high of January 6th to the low set on January 17th. This confluence of technical indicators increases the validity in the hopes that Bitcoin may find some significant support at price area.
Other technical indicators are also showing signs that the bearish momentum may be waining. RSI is fast approaching extreme oversold conditions as it finds some level of support around the 20 handle, indicating that selling pressure has reached an extreme and could be due a reversal. However, the moving averages are all pointing in the downward direction and are pulling away from one another indicating that there may be some more decline in price before a reversal can occur.
Conclusion
Bitcoin is experiencing another tough month in terms of price action with it’s short term bearish momentum. The momentum can be expected to continue over the coming days until price reaches significant areas of upcoming support.
However, in the grand scheme of the Bitcoin market, we are still not in a confirmed long term downtrend as of yet and are instead trading within a triangle of consolidation as the market decides to make up its mind of where to head next.
We are looking for the resolution of this long term triangle within the next month to provide more indication on Bitcoins next long term move.
Charts Via TradingView


