

EOS has experienced a small price decline over the past 24 hours totalling 1.81%. EOS is currently benign traded at a price of $8.28 and has enjoyed a significant 16.94% price increase over the past 7 trading days.
EOS was created to become the most powerful infrastructure for decentralised applications. It is said to be vertically and horizontally scalable which will allow it to overcome transaction speed issues recently witnessed by other blockchain based cryptocurrencies. To put this in perspective, this week EOS has exceeded 3000 transactions per second.
This far outweighs the 7 transactions per second currently capable from Bitcoin and the 25 transactions per second that Ethereum can achieve. However, this is still significantly lower than the 25,000 transactions per second that VISA can currently handle at its peak hours.
Eos has once again topped the Chinese-based cryptocurrency blockchain rankings this month, beating both Bitcoin and Ethereum making it one of the most exciting projects on both sides of the world.
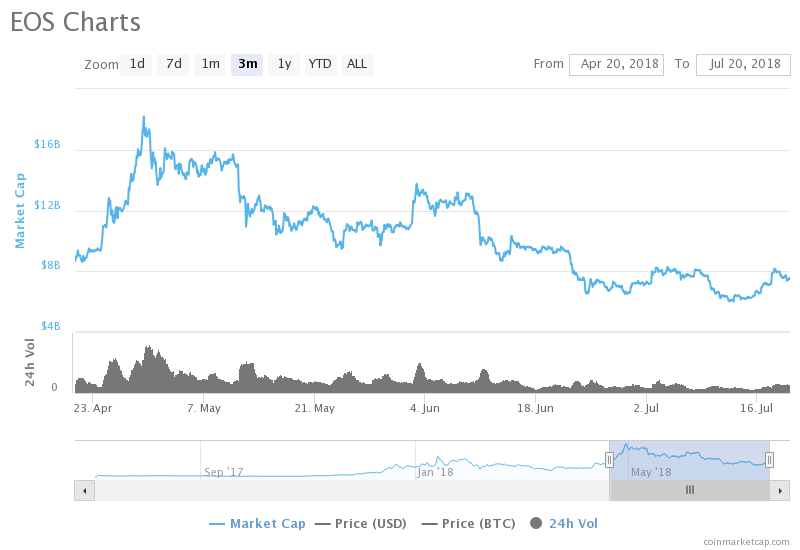
EOS is currently ranked at 5th place in terms of overall market cap across the entire industry with a total market cap value of $7.42 billion. This is an enormous $10.77 billion lower than the market cap high of $18.19 billion seen on the 29th of April, as shown in the diagram below. EOS still has gains to make as the cryptocurrency drops by 21.41% over the past 30 trading days.
Let us continue to analyse price action over the short term for EOS.
Price Analysis
EOS/USD – SHORT TERM – DAILY CHART
https://www.tradingview.com/x/UnpnrXBg/
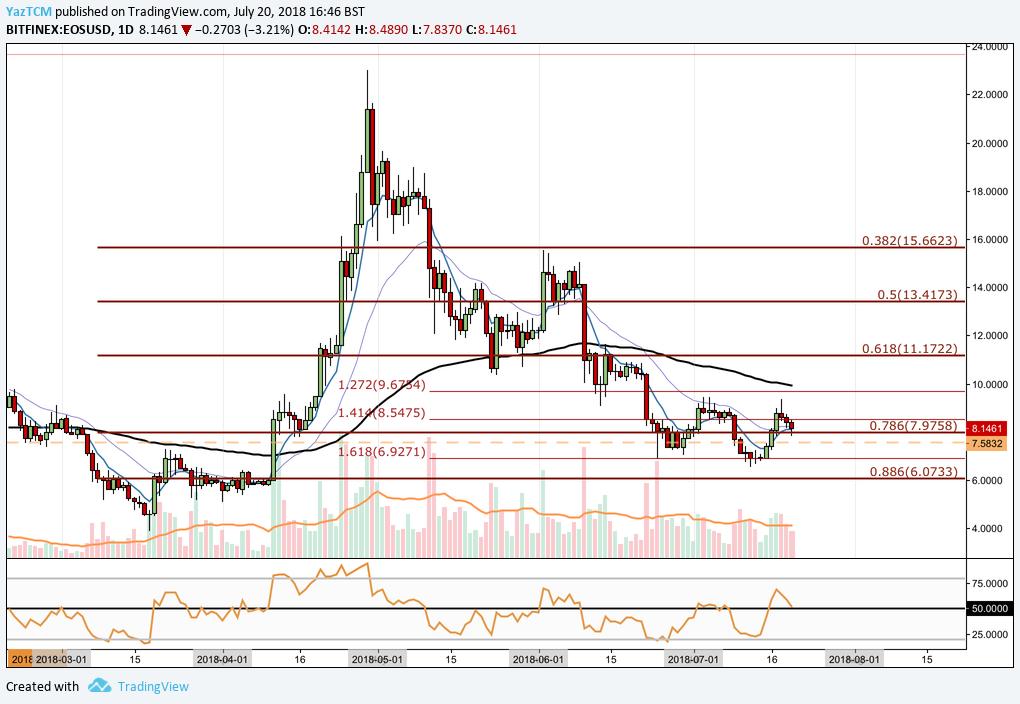
Analysing the market from the short term perspective above, we can see that EOS had experienced a significant bullish run during April when price action rose from a low of $3.87 on March 18th 2018 and extended to an all time high of $23.02 on the 29th of April 2018. This was a price increase of close to 500% from low to high.
The market went on to fall during May, originally finding support at the .618 Fibonacci Retracement level priced at $11.17. This is a Fibonacci Retracement measured from the entire bullish run mentioned above. It is also to highlight that this area of support was bolstered by the 100 day moving average at the same price level.
The market continued to fall during June and July, temporarily falling below the yearly opening price of $7.58. We can see that price action had recently dipped below the yearly opening price and the .786 Fibonacci Retracement at $7.97 until it found support at the downside 1.618 Fibonacci Retracement priced at $6.92.
The market is currently trading at support at the .786 Fibonacci Retracement level priced at $7.97. If the bearish momentum continues then near term support can be located at the yearly opening price ($7.58) and the downside 1.619 Fibonacci Retracement ($6.97). Further support below this level can be expected at the .886 Fibonacci Retracement priced at $6.07.
Alternatively, if the bulls can step back into the market again, then we can expect near term resistance to come in at the 1.272 Fibonacci Extension priced at $9.67. This area of resistance will be significant due to the fact that this level holds the 100 day moving average along with it being close to psychological round number handle at $10. If the market can continue higher than $10 we can expect further resistance to come in at the .618 Fibonacci Retracement priced at $11.17.
The technical indicators within the market are largely producing neutral signals, although they could be interpreted to slightly favour the bulls. The RSI is currently trading in a battle at the 50 handle. If it can remain above the 50 handle then we can continue to expect this market to trade in a bullish manner.
Similarly, the moving averages are currently poised for a bullish crossover signal. If the 7 day EMA can cross above the 21 day EMA then we can expect the bullish momentum within the market to increase as it heads back toward the $10 handle.


