

Like the rest of the cryptocurrency market, EOS has suffered a horrendous week in terms of vale. Although the crypto giant may only be down 1.19% over the past 24 hours, the crypto is down 26.63% over the past 7 trading days and 29.83% over the last 30 days.
The cryptocurrency is currently trading at $10.15 and currently sits at 5th rank in terms of overall market cap. EOS, at the time of writing, has a market cap to the tune of $9 billion.
EOS is said to be a decentralised operating system that allows developers to develop Dapps (Decentralised Apps) upon its blockchain. The tech behind EOS is said to solve the transaction speed and scalability issue that currently threatens Ethereum.
Over the past week, there has been some confusion amongst the EOS community as Block.One, the development house behind EOS, had officially launched their mainnet for EOS on June 10th. However, the recent mainnet launch has come to a stall as over one third of the coins required to “vote” for the mainnet to elect the required 21 “block producers” has not been met.
However, if we consider how well the market has reacted to the recent price drop mixed with this mainnet confusion, we could conclude that bulls seem to have a firm grip on EOS in the grand scheme.
Let us take a look at price action.
Price Analysis
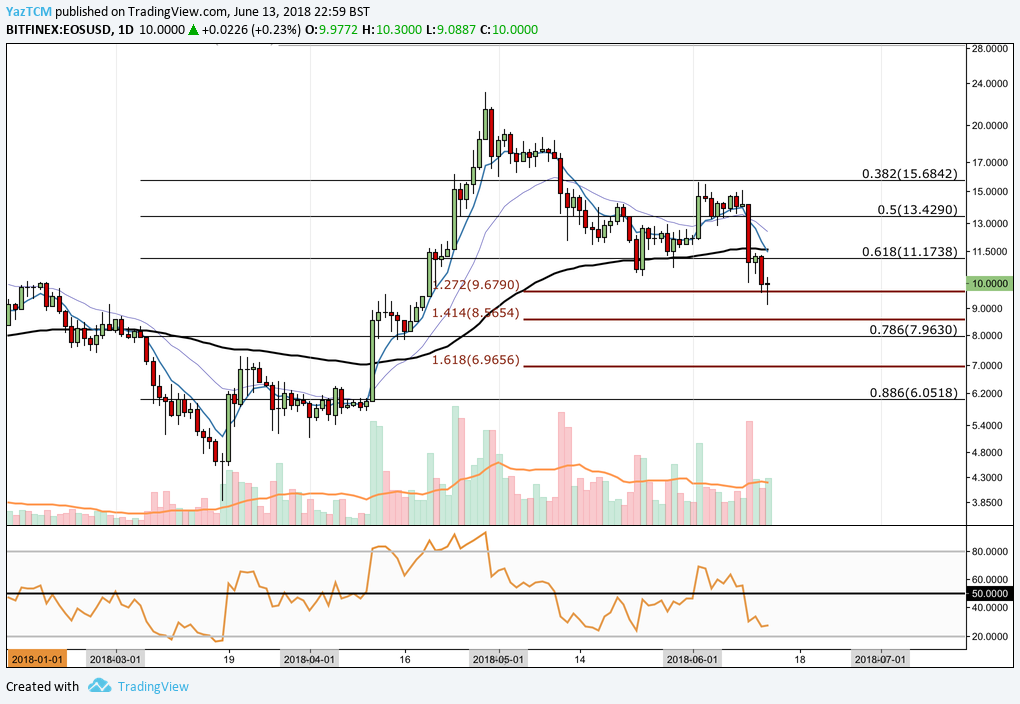
EOS/USD – DAILY CHART – SHORT TERM
https://www.tradingview.com/x/MOhrCu0h/
Analysing price action over the recent term, we can see that price had broken through the .50 Fibonacci Retracement located price $13.42. This had happened during ‘Bloody Sunday’ where cryptocurrency markets across the board wiped out over $20 billion in total market cap. During ‘Bloody Sunday’ price action had managed to gain support at the .618 Fibonacci Retracement located at $11.173, however, this level was broken on the following Tuesday when prices fell further.
Price action has currently found a form of support just above the 1.272 Fibonacci Extension at a price handle of $9.67. This is a Fibonacci Extension taken from the high experienced on May 2nd to the low experienced on May 18th. If price action can hold this level then we may see prices trade sideways until they make a recovery toward $12.
However, if price action manages to drop below the $9.67 handle then the nearest form of support is located at $7.96 which is the long term .786 Fibonacci Retracement measured from March’s low to April’s high. Following this, the next level of support to the downside is $7 – $6.95.
The technical indicators largely are signaling favour towards the bears. The RSI is well below the 50 handle as it hovers just above oversold conditions around 30. For some bullish momentum to be found within the market we would need to see RSI make its way toward 50 and eventually overcome this level.
To make matters worse for the bulls, the 7 day EMA and the 21 day EMA have recently crossed below one another indicating the increased bearish momentum within the market.
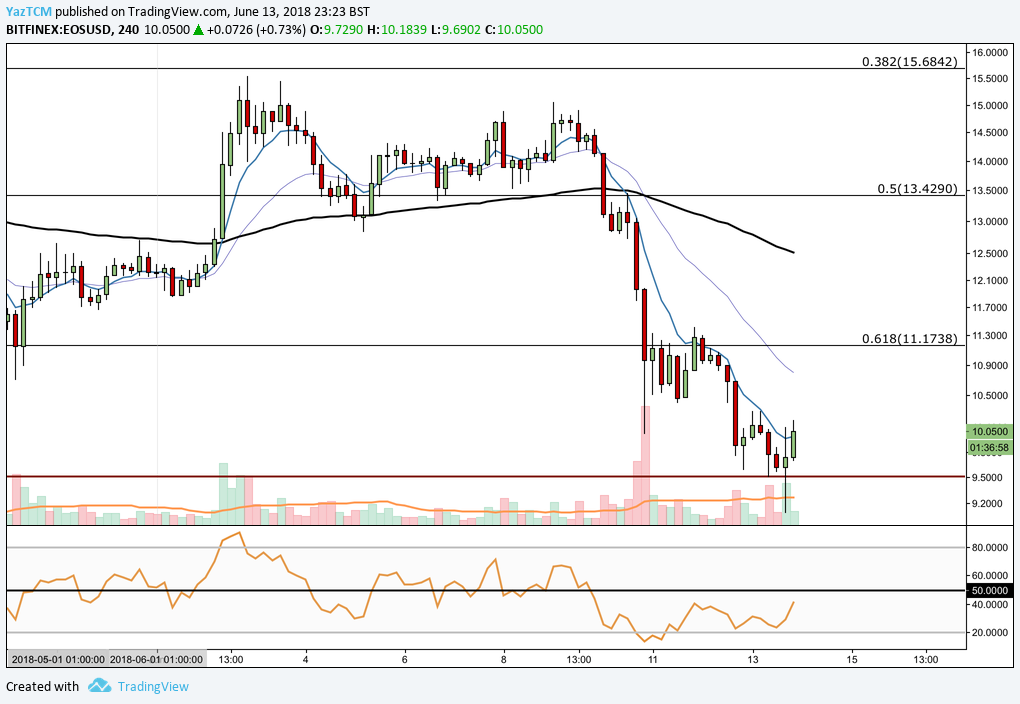
EOS/USD – 4 HOUR CHART – SHORT TERM
https://www.tradingview.com/x/dE03H4uk/
Taking an even deeper dive into price action, we can see how important the 1.272 Fibonacci Extension level at $9.67 (marked by the red line) was, as price was rejected strongly as it approached this level. The 1.272 Fibonacci Level will act as an important point of near term support over the coming trading sessions.
If the 1.272 Fibonacci Extension level can hold then price action is free to make an attempt back up above $11.17 before further testing resistance at $13.42.
On the shorter time frame, the technical indicators are showing sings that begin to favour the bulls more so than that of the daily. The RSI is making its way back toward the 50 line. If it can break and hold above this line then we may see a short term recovery within the market.


