
 Technical Analysis #002 - DigiByte Finds Support At Major Trendline and Rebounds 25% in 24 hours")
DigiByte has experienced a sharp 25% rebound over the past 24 hours of trading. The cryptocurrency is currently exchanging hands at a price of $0.026, at the time of writing, after suffering a 4.64% decline over the past 7 trading days.
DigiByte was created in 2014 by its founder Jared Tate. It is one of the most secure blockchains due to it having 5 consensus mining algorithms ensuring that not one sector can dominate mining.
The DGB network can also boast of transaction speeds far superior to Bitcoin and Ethereum. Currently DigiByte can handle around 500 transactions per second (TPS). This greatly outstrips the 7 TPS that Bitcoin can handle and the 25 TPS currently achievable by Ethereum.
In a recent interview with the CEO of ABRA, Jared Tate commented that one of DigiBytes most prominating features is that of its loyal community. Furthermore, Jared went on to announce that the DigiByte team have officially had their wallet approved by apple to be released in the iOS store. He also went on to comment that the current wallet has already had over 230,000 installs, indicating the great interest in the project.
Let us continue to analyse price action for DigiByte over the recent term.
Price Analysis
DGB/USD – SHORT TERM – DAILY CHART
https://www.tradingview.com/x/68MfjUWw/
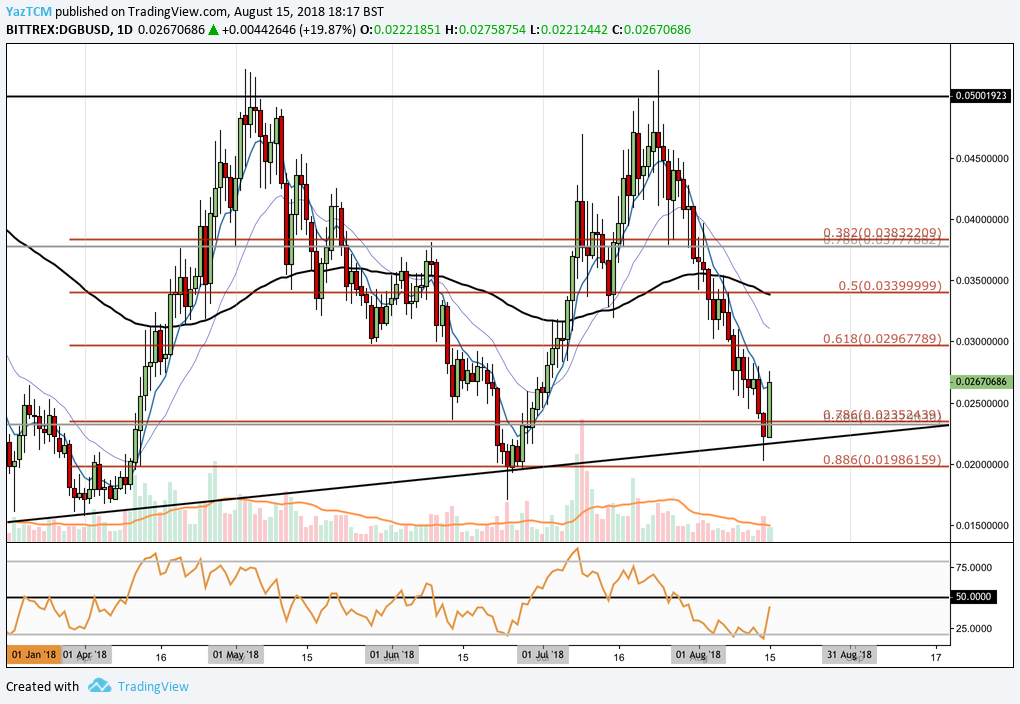
Since our last analysis piece on DGB, we can see that the month of August has been a seriously tough time for the cryptocurrency. We can see that DigiByte had experienced a relatively respectable bullish run starting from a low of $0.015 on the 1st of April 2018 and extended to a high of $0.0522 placed on the 3rd of May 2018. This was a price increase totalling 225% from low to high.
After placing this high, we can see price action rolled over and declined until support was found at the .618 Fibonacci Retracement priced at $0.029 during May. This is a Fibonacci Retracement measured from the entire bullish run outlined above.
As June started to trade, the cryptocurrency fell further lower until price action had found support at the .886 Fibonacci Retracement level priced at $0.019. We can also notice that the support at this price level was bolstered from a long term rising support trend line, drawn in black on the chart.
DigiByte went on to make another bullish run during July before hitting resistance at $0.05, the same resistance level experienced during the April 2018 bull run. From here, price action resumed its bearish trajectory and continued to fall rapidly throughout August.
We can see that price action continued to fall until recently finding support around the rising trend line once again. The rising trend line, in this scenario, was bolstered by the .786 Fibonacci Retracement priced at $0.23 which was located marginally above the trend line. The support received at this level was significant enough to warrant a 25% price increase today.
Price action has broken above the .786 Fibonacci Retracement level and has continued to ascend. If the bullish momentum can continue and keep price action above $0.023, then we expect immediate resistance to be located at the .618 Fibonacci Retracement level priced at $0.029. Further resistance expected above this level is located at the .50 Fibonacci Retracement level priced at $0.033. This area of resistance will require significant momentum to overcome due to the 100 day moving average being closely located in this area.
Alternatively, if the bearish presence re-enters the market, we expect immediate support to be provided by the .786 Fibonacci Retracmenet level priced at $0.023. Further support expected below this level will be at the upward sloping trend line. A break below the trend line would see the market heading toward the .886 Fibonacci Retracement once again priced at $0.19.
The technical indicators within the market are still favouring the bearish scenario. The RSI is trading under the 50 handle, but is rapidly approaching the level. A sustained break of the RSI above the 50 handle would indicate that the bullish momentum is beginning to take control within the market.
, and Stellar (XLM) Price Analysis – Recovery Expected Above Major Support Levels")
 and Stellar (XLM) Weekly Price Performance Overview")
