
 Technical Analysis #001 - DGB Sitting on 100 Day Moving Average Support")
DigiByte has experienced a 4.38% drop over the past 24 hours of trading. The cryptocurrency is currently trading at $0.0354 and has suffered a further 10.11% over the last 7 trading days.
DigiByte was founded in January 2014 by Jared Tate and has experienced incredible technical growth over its 4 and a half year life span. The cryptocurrency was designed to become an alternative to Bitcoin that was more secure, faster and progressively thinking in comparison.
The DigiByte blockchain has many advantages over both the Bitcoin and Ethereum blockchains. DGB can boast a 15 second block time, 500 transactions per second (expected to hit 2000 transactions per second by 2020) and SegWit already implemented. This is far superior to the 10 minute blocktime of Bitcoin with its capability of handling 7 transactions per second. To compare, Ethereum can only handle around 25 transactions per second.
To add further to the advantages of DGB, the blockchain implements a multi-algorithm mining consensus further adding to the network security. This means that many users can mine and secure the DGB network regardless of the type of hardware they own.
DigiByte is currently ranked at 33rd position in terms of overall market cap across the entire industry, with a total market cap value of $376 million. The cryptocurrency has experienced a 21.03% increase over the past 30 trading days.
Let us continue to analyse price action for DGB over the long term.
Price Analysis
DGB/USD – LONG TERM – DAILY CHART
https://www.tradingview.com/x/VJV8tCTl/
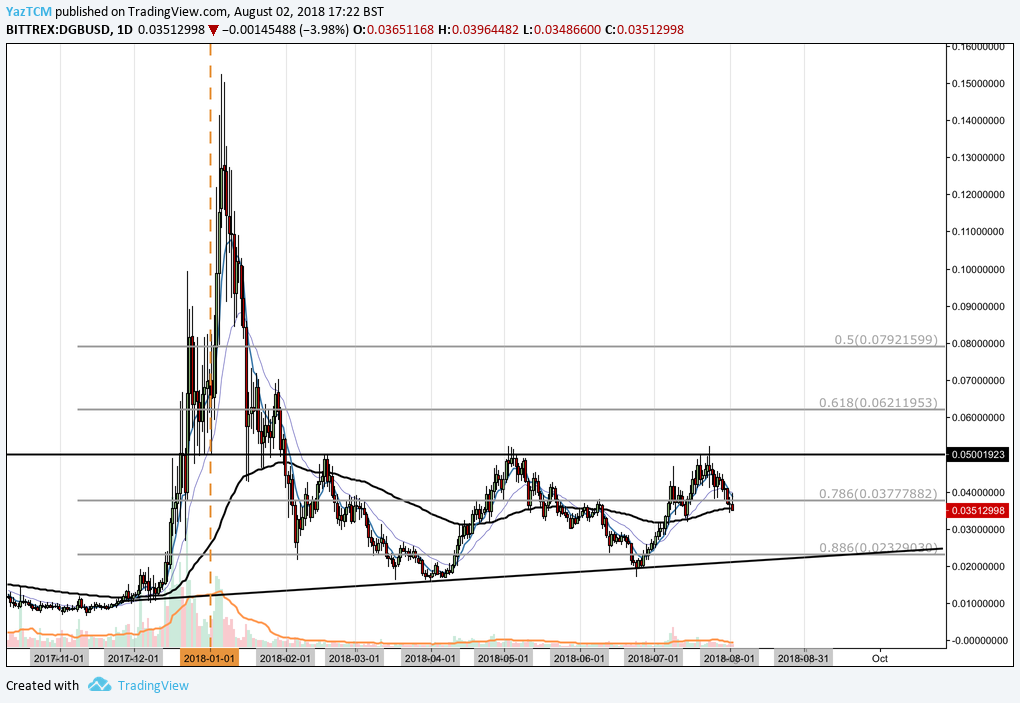
Analysing the market from the long term perspective above, we can see that DGB had experienced an incredible bullish run toward the end of 2017 when price action started from a low of $0.0081 on the 11th of November 2017 and increased all the way to an all time high priced at $0.1412 on January 5th 2018. This was a price increase totalling 1900% from low to high.
The market went on to decrease after placing the all time high, initially finding support at the 100 day moving average during January. However, the market was not able to sustain itself above this level and proceeded to fall through the 100 day moving average in February. Price action continued to fall until it found support at the .886 Fibonacci Retracement priced at $0.023 in February. This is Retracement measured from the entire bullish run outlined above.
We can see that the market fell slightly lower during March and April but found support at a rising support trend line (drawn in black). We can see that the rising trend line and the resistance that the market has met around $0.05 forms a very loose ascending triangle pattern.
Let us examine price action over the more recent period a little closer to highlight any potential support and resistance zones.
DGB/USD – SHORT TERM – DAILY CHART
https://www.tradingview.com/x/PGwgnwal/
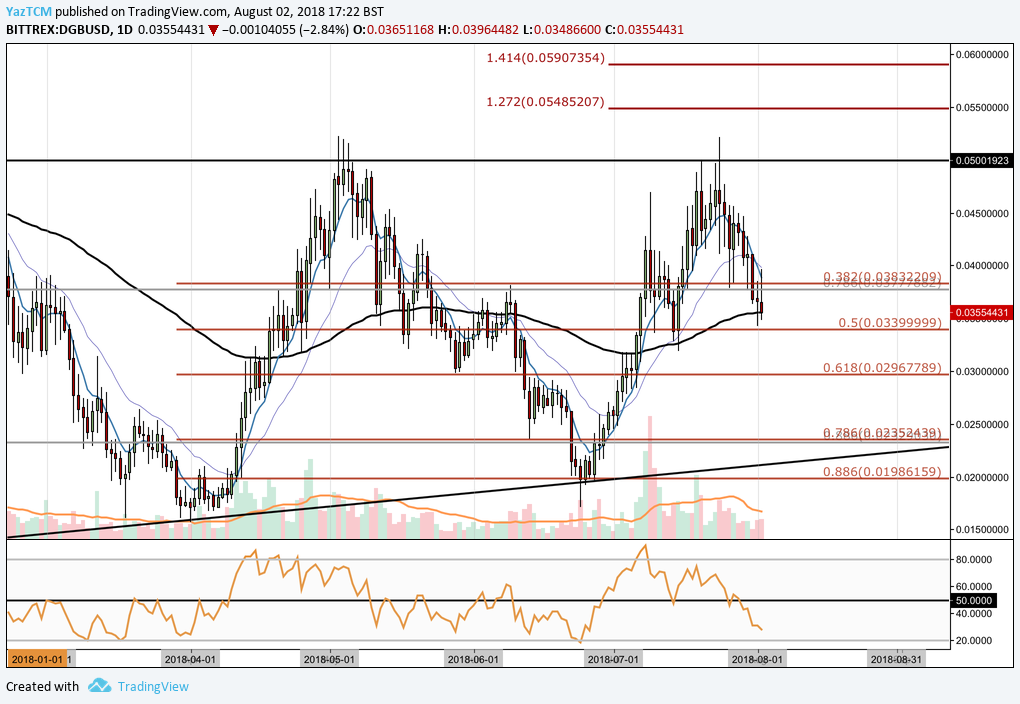
Analysing the market from the short term perspective above, we can see that the market had experienced another bullish run during April when price action started from a low of $0.0157 on April 1st and extended to a high of $0.0522 on May 3rd. This was a price increase totalling 225% from low to high.
We can see that the market went on to depreciate during May, finding support at the .618 Fibonacci Retracement priced at $0.0296. This Retracement is measured from the bullish run mentioned in the paragraph above.
However, price action was not able to hold and continued to fall during June until reaching support at the .886 Fibonacci Retracement priced at $0.1986. It is important to highlight that this area of support was bolstered by the rising support trend line that confluenced in this exact same area.
Price action went on to make a bullish run during July until it reached prior resistance marked by $0.05. We can see that the market has fallen slightly since hitting this resistance and is currently sitting at support represented by the 100 day moving average. If the market breaks below this level we expect immediate support to be located at the .5 Fibonacci Retracement priced at $0.033. Support located below this level is expected at the .618 Fibonacci Retracement priced at $0.0296.
Alternatively, if the bullish momentum can pick up steam again, near term resistance is located at the .382 Fibonacci Retracement priced at $0.038. Resistance above this area will come in at $0.05 which has proven to be a tough resistance zone throughout the entire year. In the case that the market does break above $0.05, we expect further resistance to be located at a 1.272 Fibonacci Extension priced at $0.054.
The technical indicators are heavily favouring the bears at this moment in time. The RSI is trading well below the 50 handle as it approaches oversold conditions. For a sign that the bullish momentum is re-entering the market we will look for the RSI to head back to the 50 handle and eventually break above it.


