

Dash has enjoyed a small price hike totalling up to 2.75% over the past 24 hours of trading. Dash is currently being traded at a price of around $250, at the time of writing and has suffered a small 1.24% price drop over the past 7 trading days.
Dash was created in January 2014 by Evan Duffield and was intended to become an improvement on the Bitcoin protocol. Dash was rebranded Dark Coin in 2015 in efforts to make the coin more accessible and investable to all.
The Dash protocol claims to have a 2.5 minute blocktime with near to zero fees for transactions. Compared to Bitcoins 10 minute blocktime, Dash has a significant advantage over Bitcoin. Dash also has further advanced features in the form of Private Send, which allows users to send funds to each other completely privately and Instant Send, which allows users to instantly send funds at a button click.
Dash is currently sitting at rank 14th in terms of overall market cap across the entire industry, with a total market cap value of $2.06 billion. This is a significant $2.22 billion lower than the market cap high of $4.28 billion seen on April 24th. Dash has suffered a small price increase of 3.23% over the past 30 trading days.
Let us continue to analyse price action for Dash over the long term.
Price Analysis
DASH/USD – LONG TERM – DAILY CHART
https://www.tradingview.com/x/rf6P0u68/
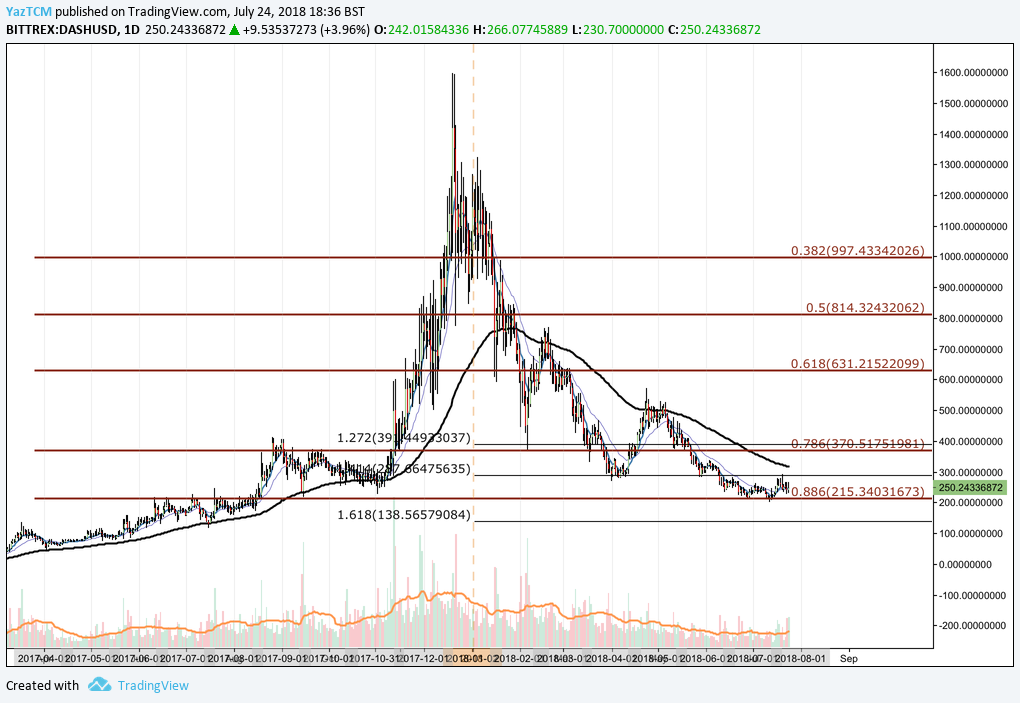
Analysing the market from the long term perspective above, we can see that Dash had experienced a significant bullish run when price action started from a low of $52 on the 2nd of April 2017 and rose to an all time high priced at $1,596 seen on December 20th 2017. This was an extraordinary price increase of 3500% from low to high.
Price action went on to fall after placing the all time high, originally finding support at the .786 Fibonacci Retracement priced at $370 in February. This is a Fibonacci Retracement measured from the entire bullish run described above. The market rebounded from this level but was strongly rejected by the 100 day moving average causing the market to drop further lower until it found support near where it is currently trading at the .886 Fibonacci Retracement priced at $215.
Let us continue to analyse price action over the more recent period to highlight any potential support and resistance zones.
DASH/USD – SHORT TERM – DAILY CHART
https://www.tradingview.com/x/vjpk82wT/
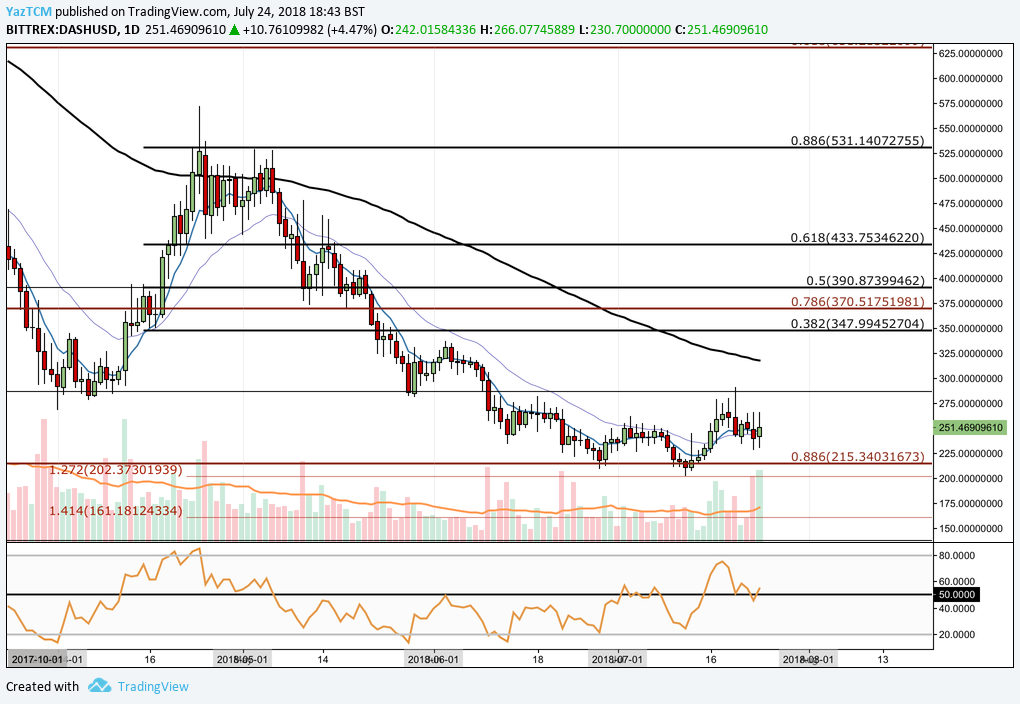
Analysing the market from the short term perspective above, we can see that Dash had experienced another, smaller, bullish run during April when price action rose from a low of $268 and extended to a high of $572 toward the end of April. However, this level also held the 100 day moving average which acted as significant resistance causing the market to fall further lower.
We can see that in July, price action dipped slightly below the .886 Fibonacci Retracement until it found support at a downside 1.272 Fibonacci Extension priced at $202. For the entire trading period during July, price action has remained trapped within a range bound between $285 and $202.
If the market can break above the upper boundary of the range at $285, we can expect near term resistance to come immediately at the 100 day moving average which is currently hovering around the $325 region. The market will need significant momentum to be able to overcome this level. Further resistance above this level can be found at the bearish .382 Fibonacci Retracement priced at $347.
Alternatively, if the market falls below the $202 handle we can expect further support to be located at the downside 1.414 Fibonacci Extension priced at $161.
The technical indicators are largely remaining neutral at this moment in time. The RSI is trading at the 50 handle. If we are to see a bullish run we will need to see the RSI break above the 50 handle and continue to rise.
Similarly, the moving averages are trading sideways indicating the indecision within the market. If the 7 day EMA (blue line) can cross up above the 21 day EMA (purple line) then this would signal a bullish crossover and indicates that the bullish pressure is beginning to increase within the market.


