
 Technical Analysis #001 - BCH trading at long term support level")
Bitcoin Cash has suffered a slight 3.44% price drop over the past 24 hours of trading. The cryptocurrency is currently exchanging hands at a price of $796 and has seen a 12.48% price hike over the past 30 trading days.
Bitcoin Cash is a cryptocurrency that had forked from the original Bitcoin network. After the long debate regarding scalability and block size, the side that believed increasing the block size decided to fork off and create Bitcoin Cash in the hopes for taking Satoshis original Bitcoin vision further.
The debate regarding scalability has been active for a number of years now. Those that believe the block size shouldn’t increase are holding their ground and waiting for SegWit2x and the Lightning Network to improve the transactions speeds for Bitcoin, arguing that increasing the block size is only a temporary solution that shouldn’t be explored.
The Bitcoin Cash protocol has an 8mb block size. This means that many more transactions can fit inside the block and therefore increasing the transactions per second. This means that users would not be waiting for extended periods of time for their transaction to occur. Along with larger block sizes BCH has no SegWit implemented and removes the “replace by fee” transaction fee applied to each transaction.
Bitcoin Cash has had short life span of just 12 months, but in this very short period of time it has risen to 4th position in terms of overall market cap across the entire industry. BCH currently has a total market cap value of $13.76 billion and is currently only sitting behind Ripple, Ethereum and Bitcoin.
Let us quickly analyse price action over the coins short lifespan.
Price Analysis
BCH/USD – LONG TERM – DAILY CHART
https://www.tradingview.com/x/zm60N17h/
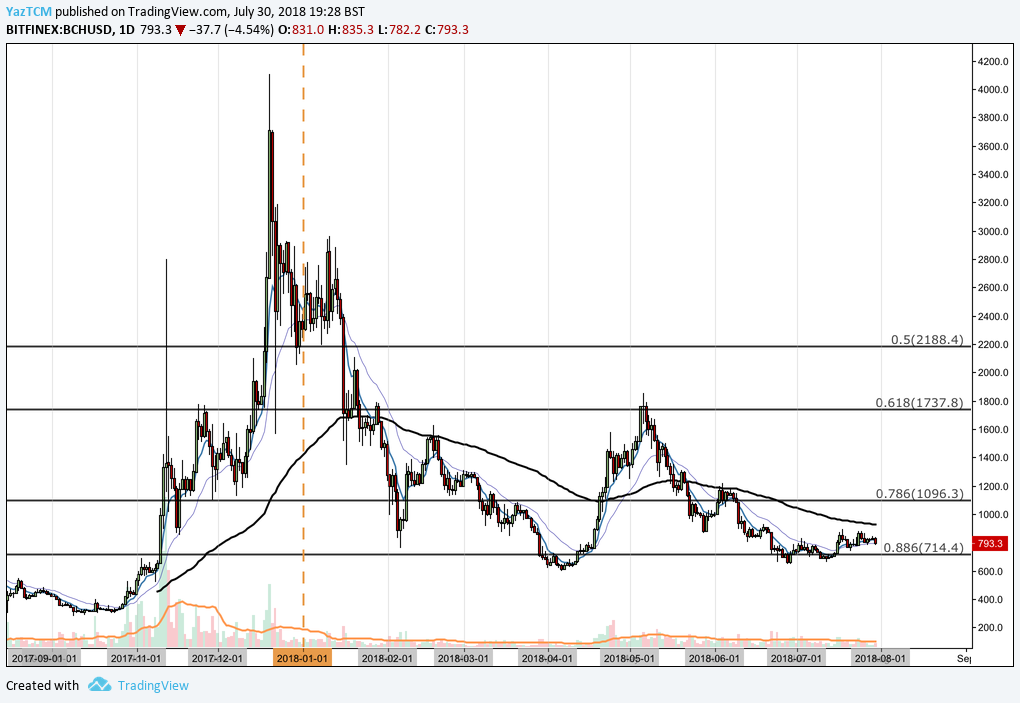
Analysing the market from the long term perspective above, we can see that Bitcoin Cash had experienced a significant bullish run toward the end of 2017 when price action started from a low of $280 on the 9th of October 2017 and extended to $4104 on the 20th of December 2017. This was an overall price increase totalling 1400%.
The market went on to decline after this all time high, originally finding support at the .618 Fibonacci Retracement priced at $1737 during January. This Fibonacci Retracement is measured from the entire bullish run described above. This area was also bolstered by the 100 day moving average which was hovering right below the .618 Fibbo at the time.
Price action could not hold above this level and continued to decline below the 100 day moving average until it found support just below the .886 Fibonacci Retracement priced at $714.
Let us continue to analyse price action over the more recent period to highlight any potential support and resistance zones.
BCH/USD – SHORT TERM – DAILY CHART
https://www.tradingview.com/x/DJnmpJ4T/
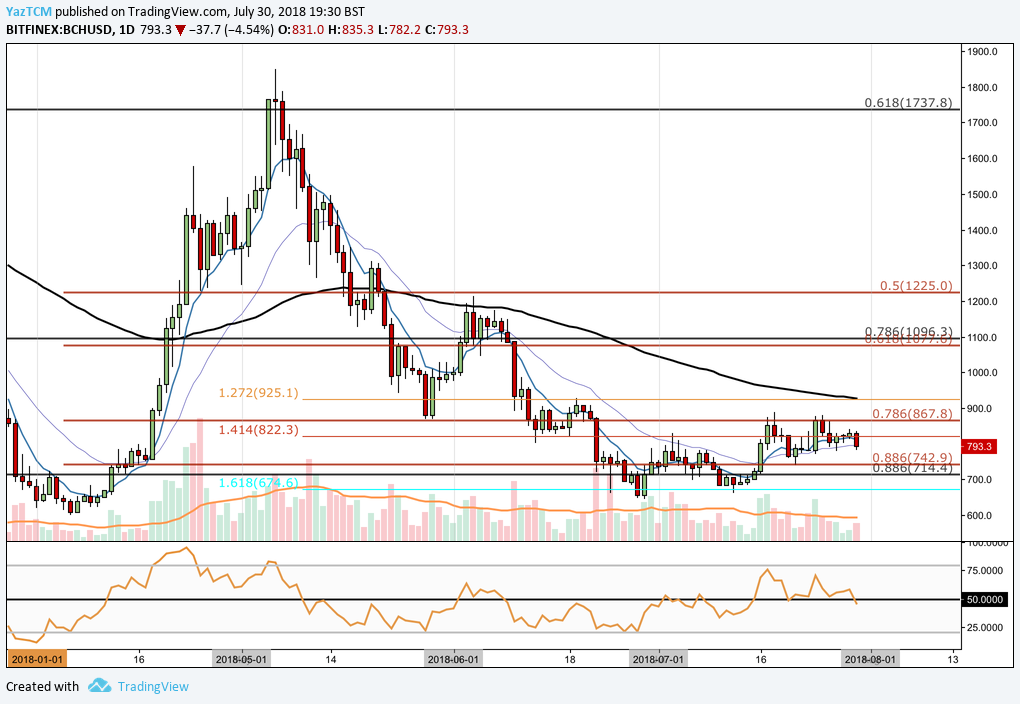
Analysing the market from the short term perspective above, we can see that price action had experienced another bullish run during April when price action started from a low of $600 on April 6th 2018 and extended to a high of $1849 on May 6th 2018. In the space of this one month, price action had increased to 208%.
The market went on to decline during May, falling through the 100 day moving average again until it found support at the .short term .786 Fibonacci Retracement priced at $867. As June continued to trade, the market fell further lower until it found support at the long term .886 Fibonacci Retracement priced at $714.
It is important to highlight the confluence of indicators in this area adding to the weight of the expected support here. We can see price action had found support at a downside 1.618 Fibonacci Extension priced at $674. There is also a short term .886 Fibonacci Retracement in the area priced at $742.
For the trading month of July, price action has been stuck in a range, bound between $867 and $674. If the market can push price action above $867 we expect near term resistance to be immediately located at the downside 1.272 Fibonacci Extension priced at $925.
This area of resistance is, once again, bolstered by the 100 day moving average that is currently hovering within this area. Resistance higher than this level is expected around the $1096 handle which is the long term .786 Fibonacci Retracement level.
The technical indicators within the market are currently favouring neither side. The RSI is currently trading at the 50 handle. If we would like to sea bullish breakout in this market we would need to see the RSI make its way above 50 and continue toward overbought conditions.
The moving averages are slightly favouring the bulls at this moment in time as the 7 day EMA is above the 21 day EMA. In the even that bullish momentum increases within the market, we would witness the 7 day EMA rise further away from the 21 day EMA.


