
")
Basic Attention Token has enjoyed a 24 hour price hike of 6.95% as BAT tokens currently trade at $0.3542. This comes after the cryptocurrency enjoys a 31.49% price increase over the past 7 trading days.
Basic Attention Token was created by Brendan EIch in 2015. It is attempting to change the entire online advertising industry by blocking all trackers and cookies. The BAT token will achieve this through its integration with the Brave browser.
Brave was created by Eich, it is a pro sign browser due to the fact that it is faster and more secure than its browser giant competitors such as Google Chrome and Mozilla Firefox. In fact, Brendan Eich is actually the co-founder of Mozilla Firefox, indicating his ability to create a supreme browser.
The Brave browser comes integrated with built in support for ad blocking and script disabling so the user has no need to download third party software to do this. It also allows users to have the ability to decide which ads they wish to be displayed and can even be remunerated to view ads. As of July 2018, the Brave browser has officially reached over 3 million users which is a fantastic achievement in the cryptocurrency space.
BAT token is currently ranked at 38th in terms of overall market cap with a total market cap value of $354 million. THis is $168 million lower than the market cap high of $354 million seen on May 2nd.
Let us continue to analyse price action for BAT.
Price Analysis
BAT/USD – LONG TERM – DAILY CHART
https://www.tradingview.com/x/hgNjs5ZY/
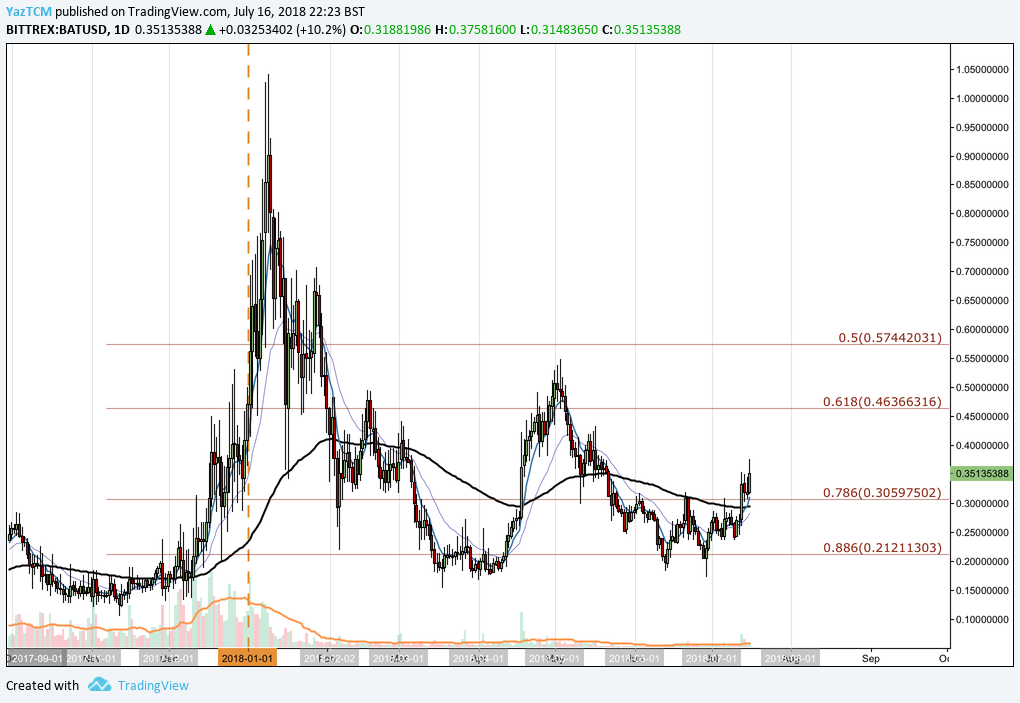
Analysing price action over the long term, we can see that the market had experienced a major bullish run when price action rose from a low of $0.10 on the 12tho f November 2017 and extended to a high of $1.04 on the 9th of January 2018. This was a bullish increase of over 770% from low to high.
Price action went on to fall throughout the majority of 2018 until the market reached support at the .886 Fibonacci Retracement priced at $0.21. This is a Fibonacci Retracement of the entire bullish run described above.
We can see that during July, the recent bullish run has caused price action to break above the 100 day moving average and the .786 Fibonacci Retracement priced at $0.30. Price action is currently producing two month highs as it currently moves through this bullish run.
Let us continue to analyse price action over the short term to highlight any potential support and resistance zones.
BAT/USD – SHORT TERM – DAILY CHART
https://www.tradingview.com/x/938YnDFv/
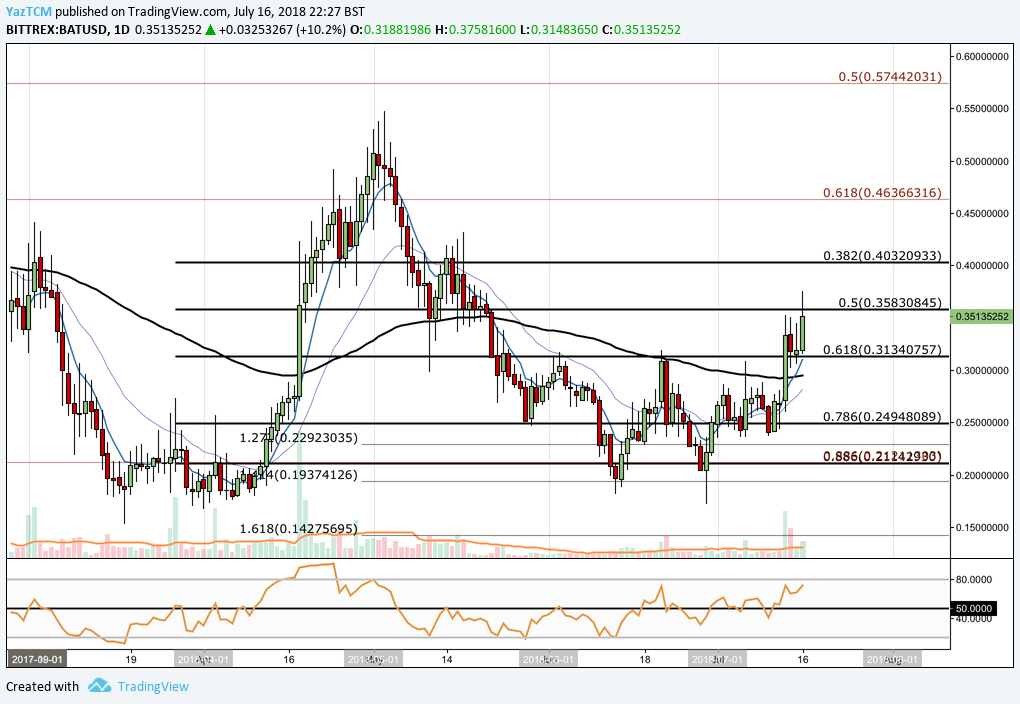
Analysing price action over a shorter period, we can see that the market had experienced a further bullish run when it rose from a low of $0.16 on the 1st of April 2018 and ran to a high of $0.57 on the 3rd of May. This was a price increase of 230% over the 34 day period.
Price action has since declined, originally finding support at the .786 FIbonacci Retracement in May priced at $0.24. This is a Fibonacci Retracement measured from the entire bullish run described above.
The market continued to fall during June, eventually double bottoming toward the end of June at the .886 Fibonacci Retracement priced at $0.21. It is important to highlight that this area confluences both the short and long term .886 Fibonacci Retracements in this area adding to the level of support expected here.
Price action is currently trading at resistance at the .50 Fibonacci Retracement priced at $0.35. If the bullish run can push price action above this level then near term resistance is expected at the .382 Fibonacci Retracement priced at $0.40 followed by the long term .618 Fibonacci Retracement priced at $0.46.
Alternatively, if the bears step in once again and pushes prices lower, near term support can be expected at the .618 Fibonacci Retracement priced at $0.31 followed by the .786 Fibonacci Retracement priced at $0.24.
The technical indicators are largely favouring the bulls at this moment in time. The RSI is currently trading well above the 50 handle and is approaching oversold conditions at the 80 handle. If the RSI can remain above the 50 handle we can expect the bullish momentum to remain within the market.

, and Stellar (XLM) Price Analysis – Recovery Expected Above Major Support Levels")
 and Stellar (XLM) Weekly Price Performance Overview")