
 Technical Analysis - Brave Reaches 10 million downloads; Indicators Reading Neutral Currently")
Basic Attention Token has seen a small 2.50% price hike over the past 24 hours of trading. The cryptocurrency is currently exchanging hands at a price of $0.21 after seeing a 2.11% price increase over the past 7 trading days.
The privacy focused web browser, Brave, which integrates a BAT wallet inside the software, has announced that they have officially reached over 10 million downloads in the App Store. This is a major milestone in a company that has only been around for a short few years.
The Brave/BAT network is intending to rethink the way that advertisements are delivered on the internet based off of user attention. The Brave browser has consistently provided faster page load speeds than top quality competitive browsers such as Google Chrome and Mozilla Firefox.
One of the only complaints noticed about the Brave browser is that people feel the user interface is outdated, however, this is not too big of a problem to stop more people using the software and being introduced to Basic Attention Token.
BAT is currently ranked at 40th position in terms of overall market cap across the entire industry with a total market cap value of $214 million. The cryptocurrency has started to show signs of recovery after losing a significant 35% in value over the past 30 trading days.
Let us continue to analyse price action for BAT over the short term.
Price Analysis
BAT/USD – SHORT TERM – DAILY CHART
https://www.tradingview.com/x/OKmc93yo/
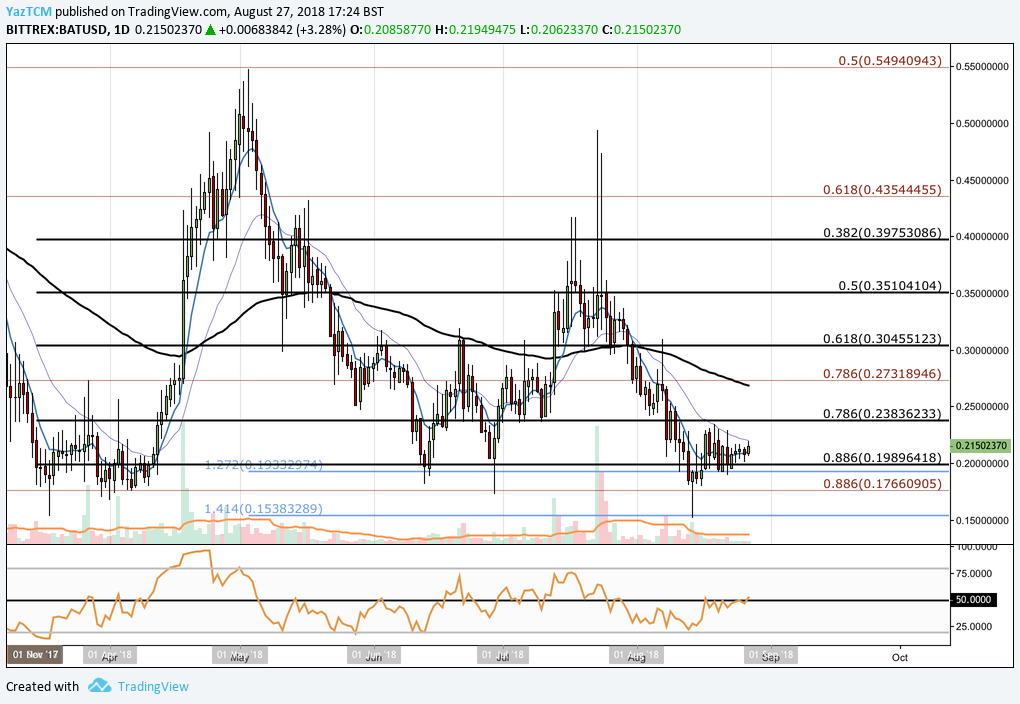
Analysing price action for BAT over the past few months, we can see that the market had experienced a bullish run as price action started from a low of $0.15 on the 18th of March 2018 and extended to a high of $0.54 on the 3rd of May 2018. This was a price increase totalling 250% from low to high.
We can see that after placing this high, price action continued to roll over, initially finding support at the .618 Fibonacci Retracement priced at $0.30 in May 2018. This Fibonacci Retracement is measured from the short term bullish run highlighted above.
Price Action continued further lower during June 2018 to find support at the .886 Fibonacci Retracement period priced at $0.19. We can see that this area of support was significantly bolstered by a downside 1.272 FIbonacci EXtension level (drawn in blue) priced in the same area.
Price action made a rebound form this area during July, however, BAT was not immune to the August bloodbath seen throughout the entire industry as the token began to fall further lower, once again.
We can see that, during August, price action fell precipitously but found a significant level of support, once again, at the short term .886 Fibonacci Retracement level priced at $0.19. We should also highlight that on the 14th of August 2018, price action spiked lower to find support and rebound at the short term downside 1.414 Fibonacci Extension level priced at $0.15.
Price action is now trading within a narrow range bound between the .786 and .886 Fibonacci Retracements priced at $0.23 and $0.19 respectively. If the bulls can push price action above the upper boundary at $0.23 we expect immediate resistance to be located at the previous long term .786 Fibonacci Retracement (drawn in red) priced at $0.27.
This area of resistance will require significant momentum to overcome due to the 100 day moving average also floating within the same price area. Further resistance above this level is then expected at $0.30 and then $0.35.
Alternatively, if the bears push price action below $0.19, we expect immediate support to be located the long term .886 Fibonacci Retracement (drawn in red) priced at $0.17. Further support below this is expected at the previous downside 1.414 Fibonacci Extension level priced at $0.15.
The technical indicators within the market are currently producing neutral readings as the RSI trades directly on the 50 handle. This shows that the market is waiting to decide which direction to go next. If the RSI can sustain a break above the 50 handle we can expect the bullish momentum to grow within the market.


