
 Technical Analysis #002 - BAT Supported By Long Term Fibonacci Level")
Bat token has experienced a small 2.54% price relief from the brutal beating that the majority of the crypto market is experiencing. BAT token is currently trading at $0.2146 per token after suffering a 15% price decline over the past 7 trading days.
BAT token, founded by Brendan Eich in 2015, is intended to revolutionise the online advertising industry. The plan on doing this by rethinking the way that adverts are delivered by created a digital advert exchange based off of user attention. This would allow advertisers to purchase advertising space, specifically, user attention by using the BAT currency.
The goals will be achieved through the integration of BAT token through the Brave browser, a privacy focused web browser that can rival Google Chrome or Mozilla Firefox (PSA: Eich was also the creator of Firefox). Brave has been slated to be twice as fast as Mozilla and already has established a user base of over 3 million users.
BAT token is currently ranked at 39th position in terms of overall market cap across the entire industry, with a total market cap value of $214 million. The 14 month old coin has substantial losses to recover after suffering a 36% beating over the past 30 trading days.
Let us continue to analyse price action for BAT over the long term.
BAT/USD – LONG TERM – DAILY CHART
https://www.tradingview.com/x/Ipus3yoi/
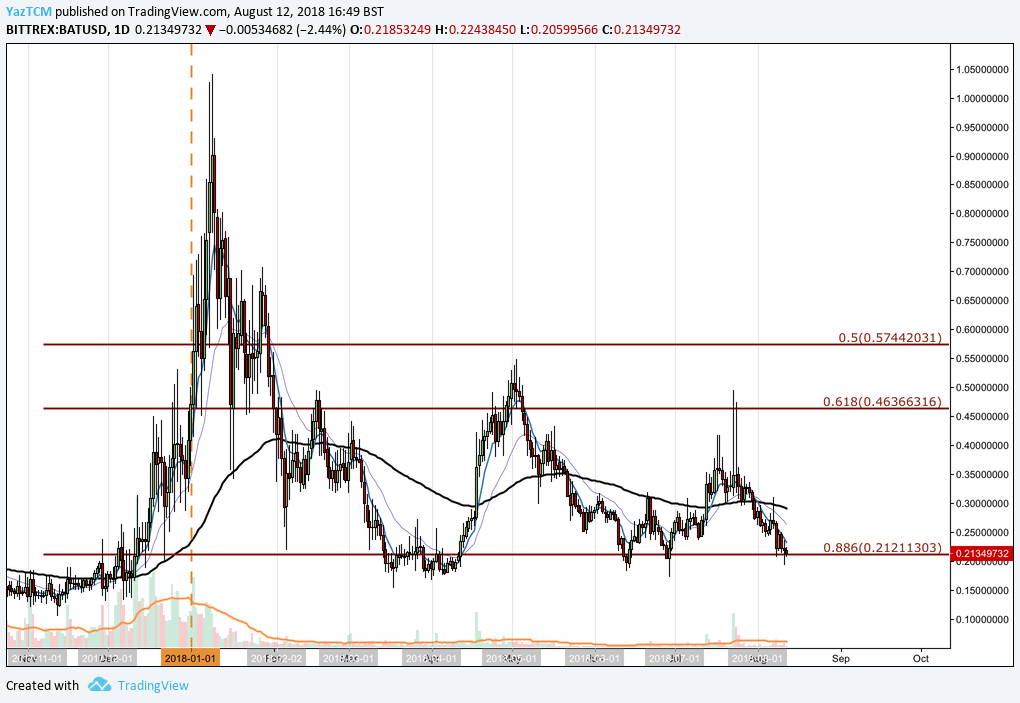
Analysing the market from the long term perspective above, we can see that BAT had experienced a significant bullish run starting from a low of $0.10 on the 12th of Nov 2017 and extended to an all time high of $1.04 on the 9th of Jan 2018. This was a price increase totalling 770% from low to high.
We can see that the market rolled over after placing this high, initially finding support at the long term .618 Fibonacci Retracement level priced at $0.46. This is a Fibonacci Retracement measured from the entire bullish run mentioned above.
We can see that the market was not able to sustain itself at this level and continued to roll over until it found support around the .886 Fibonacci Retracement level in March, priced at $0.21. We can see that his price level has provided significant support for the market throughout the entire trading year. Price action has currently found support directly on the .886 Fibonacci Retracement.
Let us continue to analyse price action a little closer over the short term to highlight any potential support and resistance zones.
BAT/USD – SHORT TERM – DAILY CHART
https://www.tradingview.com/x/BFM61uuV/
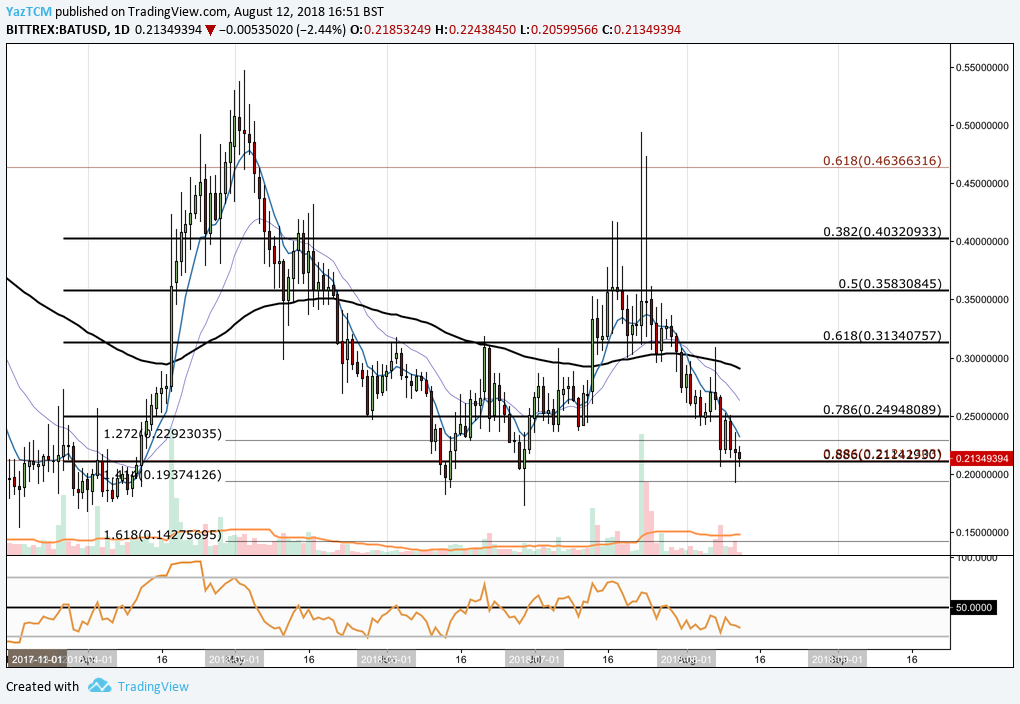
Analysing price action over a shorter period, we can see that the market had experienced a smaller price rally during April when price action started from a low of $0.16 on April 1st and extended to a high of $0.57 on May 3rd. This was a price increase totalling 230% from low to high.
We can see that the market proceeded to roll over during May, initially finding support at the short term .786 Fibonacci Retracement priced at $0.24. THis Fibonacci Retracement is measured from the bullish run highlighted above. Price action continued to fall further below this level until finding support, during June, at the .886 Fibonacci Retracement priced at $0.21. We can see that this price area of support is significantly bolstered by the long term .886 Fibonacci Retracement (outlined in the long term analysis above) priced in exactly the same area.
Price action is currently trading at this combination of short and long term .886 Fibonacci Retracement levels priced at $0.21. If the bulls can gather momentum from this area, we expect immediate resistance to be located at the short term .786 Fibonacci Retracement priced at $0.24. Further resistance above this level is expected at the 100 day moving average which is currently hovering at the round number psychological resistance level of $0.30.
Alternatively, if the bears manage to continue their domination within the market and push price action below the .886 Fibonacci Retracement, we expect immediate support to be located at a downside 1.414 Fibonacci Extension level priced at $0.19. Further support below this level is expected at April’s price low at $0.16.


