

Waves has experienced a small 1% drop in trading over the past 24 hours. The cryptocurrency is currently priced at $1.82 and has suffered a significant 28% drop over the past 7 trading days. Despite this, Waves has hit support at a major long term level and support is expected to hold.
The Waves platform was founded by Sasha Ivanon on the 7th of June 2016. It is an all encompassing platform with many facets. The blockchain based cryptocurrency allows users to create custom tokens in a simple, easy to use manner granting access to the everyday user to create and distribute their own tokens. Users can do many things with their own tokens including creating their own loyalty reward programs.
The Waves platform also features a complete decentralised exchange. This allows users to transfer and exchange cryptocurrencies without the need to risk their cryptocurrencies in the trust of a middle man.
One fault in cryptocurrency trading is that when you leave your crypto in exchanges they are susceptible to hacks, which has happened time and time again. A decentralised exchange is an evolution of the typical centralised exchanges and removes this risk of the middle man.
The platform also includes fiat gateways which are fully equipped with KYC (know your customer) standards. This allows users to deposit funds to the Waves platform to exchange their fiat easily for cryptocurrency.
Waves is currently ranked at 52nd position in terms of overall market cap across the entire industry, with a total market cap value of $181 million. Waves has lots of losses to regain as the cryptocurrency has fallen 38% over the past 30 trading days and 70% over the past 90 trading days.
Let us continue to analyse price action for Waves over the long term.
Price Analysis
WAVES/USD – LONG TERM – DAILY CHART
https://www.tradingview.com/x/lkLEDGwQ/
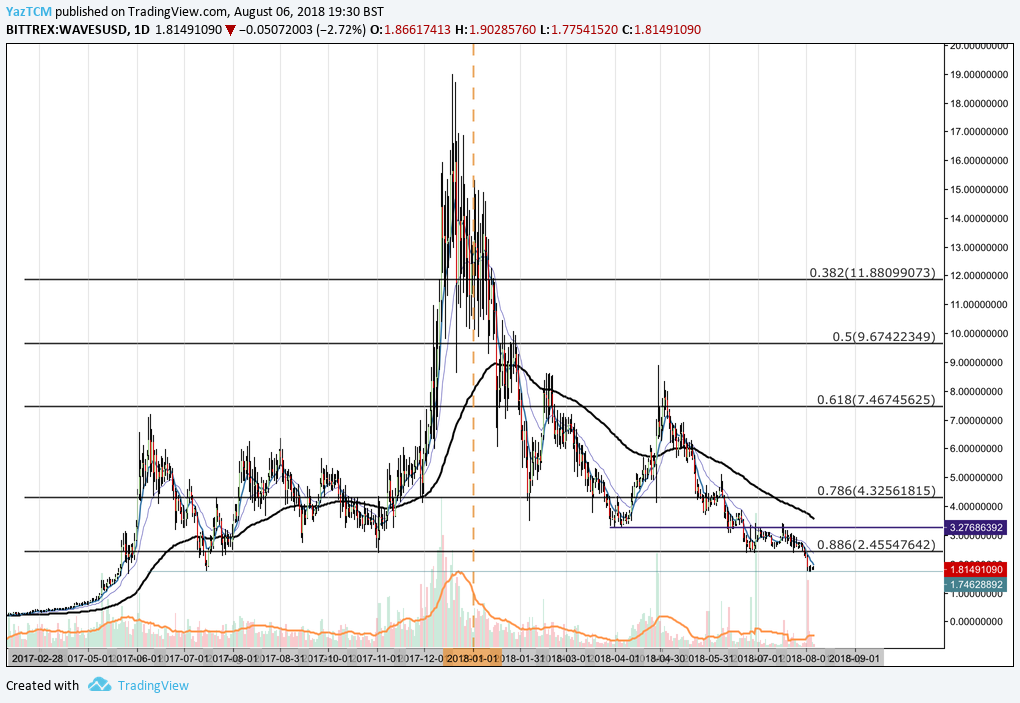
Analysing the market from the long term perspective above, we can see that Waves had experienced an incredible bullish run during 2017 when price aciton started from a low of $0.33 on the 2nd of April 2017 and extended to an all time high of $18.98 on the 19th of December 2017. This was a price increase totalling over 6000% from low to high.
We can see that the market rolled over after placing this all time high and continued to fall until it found support at a .786 Fibonacci Retracement priced at $4.32. This Fibonacci Retracement is measured from the entire bullish run outline in the paragraph above.
We can see that this Fibonacci Retracement level continued to hold until price action fell below this level convincingly during June where it fell to find support at the .886 Fibonacci Retracement priced at $2.45.
The .886 Fibonacci Retracement price level had provided significant support throughout the course of 2017 and was expected to be an important pivotal zone in the downward trend. However, the market was not able to sustain itself above this level and continued to fall as August started trading.
We can see that the market has found support at the $1.74 price level which was the price low seen during July 2017.
Let us continue to analyse price action a little closer over the short term to highlight any potential support and resistance areas.
WAVES/USD – SHORT TERM – DAILY CHART
https://www.tradingview.com/x/IcqZnQS5/
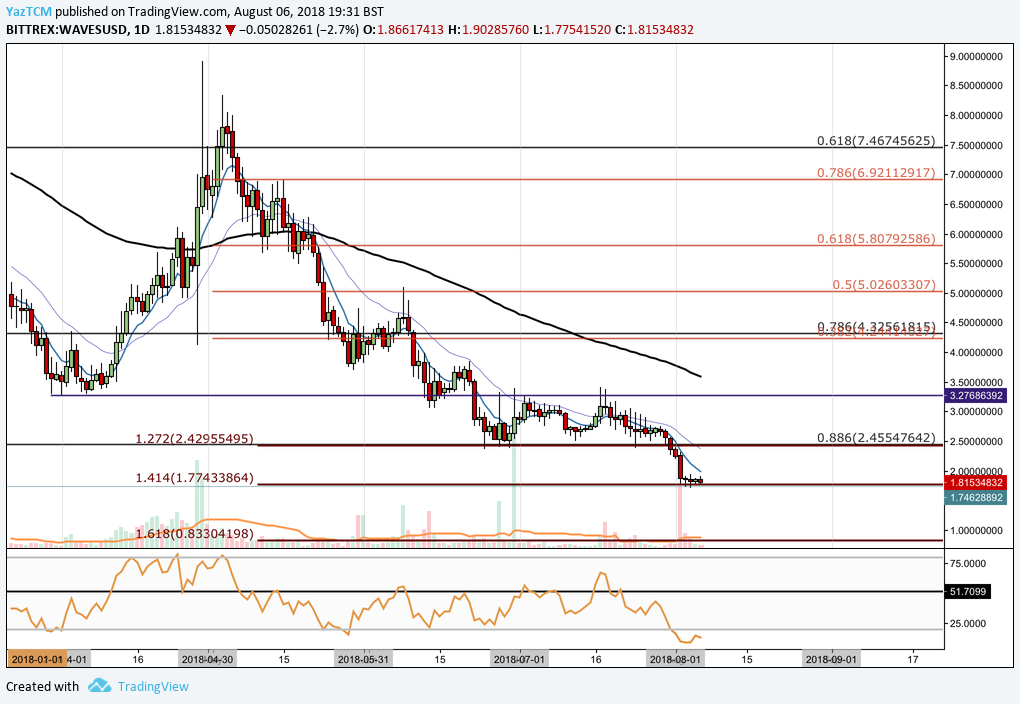
Analysing the market over the shorter term we can see that Waves had experienced a smaller bullish run during April when price action started from a low of $3.27 on the 1st of April and extended to an intermediary high priced at $8.35 on the 3rd of May. This was a price increase totalling 157% from low to high.
The market rolled over after placing the high and continued to fall below the 100 day moving average. Price action was not able to recover and fell far below the initial starting point of the April bullish run mentioned above.
We can see that during June and July, price action had found support at the long term .886 Fibonacci Retracement level (mentioned in the above section) priced at $2.45. This support level was significantly bolstered by a short term downside 1.272 Fibonacci Extension level priced in the same area.
However, during August, the market fell below this level and continued to drop until it found support at the short term downside 1.414 Fibonacci Extension level priced at $1.77. If the bearish momentum continues and pushes price action further lower we expect immediate support to be located at $1 followed by the 1.618 Fibonacci Extension priced at $0.83.
Alternatively, if the bulls can gather significant momentum from this area, we expect immediate resistance to be located at the long term .886 Fibonacci Retracement level again priced at $2.45. Further resistance above this level is expected at the April low’s, $3.27, followed by the 100 day moving average which is currently hovering around $3.50.
The technical indicators are heavily favouring the bears at this moment in time as the RSI trades at oversold conditions. For the bulls to step back into the market we will need to see the RSI break back above the 50 handle.
, and Stellar (XLM) Price Analysis – Recovery Expected Above Major Support Levels")
 and Stellar (XLM) Weekly Price Performance Overview")
