
 Technical Analysis #002 -Could a BTC reversal be imminent _")
Bitcoin (BTC) Technical Analysis #002 – Rebounds after approaching major support zones. Could a BTC reversal be imminent?
Bitcoin could be showing some promising signs as the end of a bearish month approaches. Over the past 24 hours, BTC has seen a 2.5% increase in terms of it price, at the time of writing. This small ray of hope for the bulls comes after a month of turmoil within the cryptocurrency markets.
Over the past 30 days, BTC had experienced a 6.90% decline, with a 9.8% reduction in price occurring over the past 7 days.
Long Term –
https://www.tradingview.com/x/ZCVHl907/
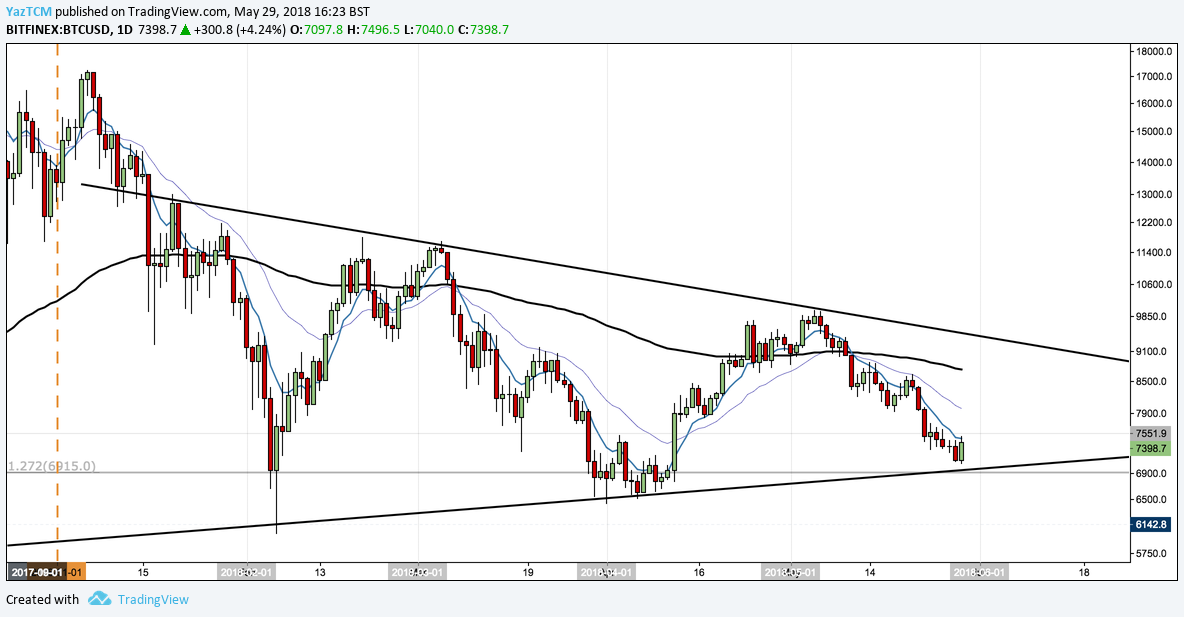
Not much has changed from a long term perspective for the price of Bitcoin. We are still trading within a long term triangle outlined in our previous article. If you missed it, here is a link for a quick refresher LINK.
Looking at the chart, we can see that BTC is fast approaching the lower rising support line of the symmetrical triangle. Traders have been trapped within the confines of this symmetrical triangle for over the previous five months.
From a long term basis, BTC has a long way to go before being able to be considered to be trading within a bullish market. Price action would first have to break through the upper boundary of the triangle, which is possible at some point within the next trading month.
Following this, price action would have to continue to break and close above the $10,000 handle, which was the high set out close to the beginning of the month. If Bitcoin price action manages to trade above $10,000 then the next upside target would come it at the highs set out in March at $11,700.
Todays price action, discussed further below, could indicate that price is showing signs of a potential reversal but a closure of the candle would be required for confirmation of this technical reversal.
Near Term –
Although May has proven to be a bearish month for Bitcoin, there are short-term signs to indicate that the previous bearish momentum may be slowing.
Daily Chart
https://www.tradingview.com/x/1nQsYTWK/
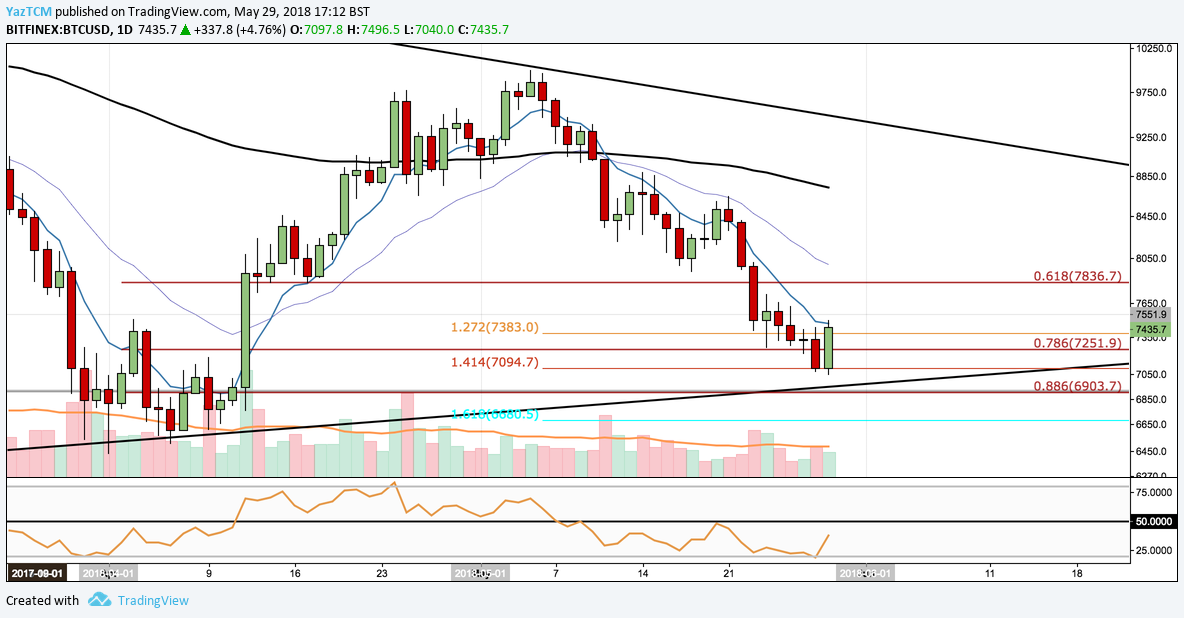
Over the past few days, bears have been dominating price action as Bitcoin price action experienced a break below a recent Fibonacci Retracement level. This Fibonacci level was not expected to hold as, mentioned in our previous article.
However, this break below the .786 Retracement may prove to only be brief. Price action has managed to break back above the .786 Fib Retracement of $7,251 and is trading at around $7,420. If price manages to hold and close the day around this price, then we could see the formation of a technical reversal pattern known as bullish engulfing.
A bullish engulfing candlestick pattern would signify a reversal of the current trend could be imminent. It is important to closely follow price action over the next few days to confirm a short-term price reversal.
The RSI has also continued to show some signs of improvement as it found stability in extreme oversold conditions at the 20 handle. A strong bounce has been experienced, a break above the 50 handle would be needed to add to the confirmation of a short term Bitcoin price reversal.
4-Hourly Chart
https://www.tradingview.com/x/uVvJUgqv/
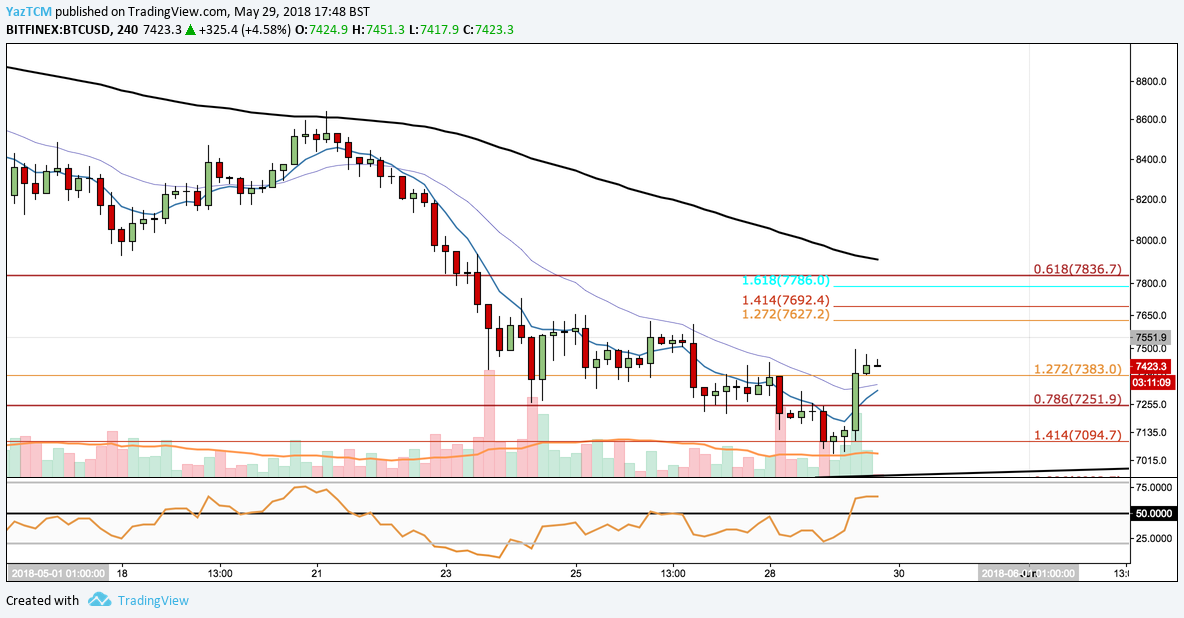
From the 4-Hr chart above, we can see that BTC found resistance at the downside Fibonacci Extension 1.414 at the price handle $7,094 before seeing a small reversal. This Fibonacci Extension was taken from highs of $9,956 set out on the 6th of May to the low of $7,935 set on the 18th of May.
If BTC can continue with its upside momentum and break above near term resistance at $7,450 then we could expect price to head toward the $7,627-$7,692 region before making an attempt to re-test the .618 support (now resistance) level of $7,836.
Alternatively, if this short-term reversal proves to be brief, BTC could head back lower toward to $7,094 handle before possibly heading toward the bottom line of the long-term symmetrical triangle in play. In this scenario, we may experience BTC prices that are below $7,000 for a short period of time.
The 4hr RSI has broken above 50 and is heading closer toward overbought territory which could mean this short-term reversal is short lived.
Conclusions
May has been a terrible month for BTC, starting from highs edging $10,000, price action has continued its decrease all the way to a low of $7,050.
Near-term signals may start to be showing possibilities that a reversal is imminent, however, it is important to watch the market closely for confirmations for signs of this reversal.
Bitcoin may continue lower, to reach the lower confinement of the symmetrical triangle before a full reversal is experienced. June will prove to be an important month to understand in which direction BTC would want to head next, a positive bullish break of the symmetrical triangle leading on to new yearly highs or a bearish break below $7,000 continuing Bitcoins market woes.


