
 Technical Analysis #002 — Experiences Corrections as Crypto Markets takes dive")
Despite it’s extremely hyped upcoming MainNet launch this week, Tronix, the brain child of Justin Sun, returned the majority of its previous weeks gains, yesterday, as prices fall toward weekly lows.
This price correction has been apparent throughout the majority of altcoins across the entire board.
Long Term Overview
TRX/BTC
https://www.tradingview.com/x/xcimCWtH/
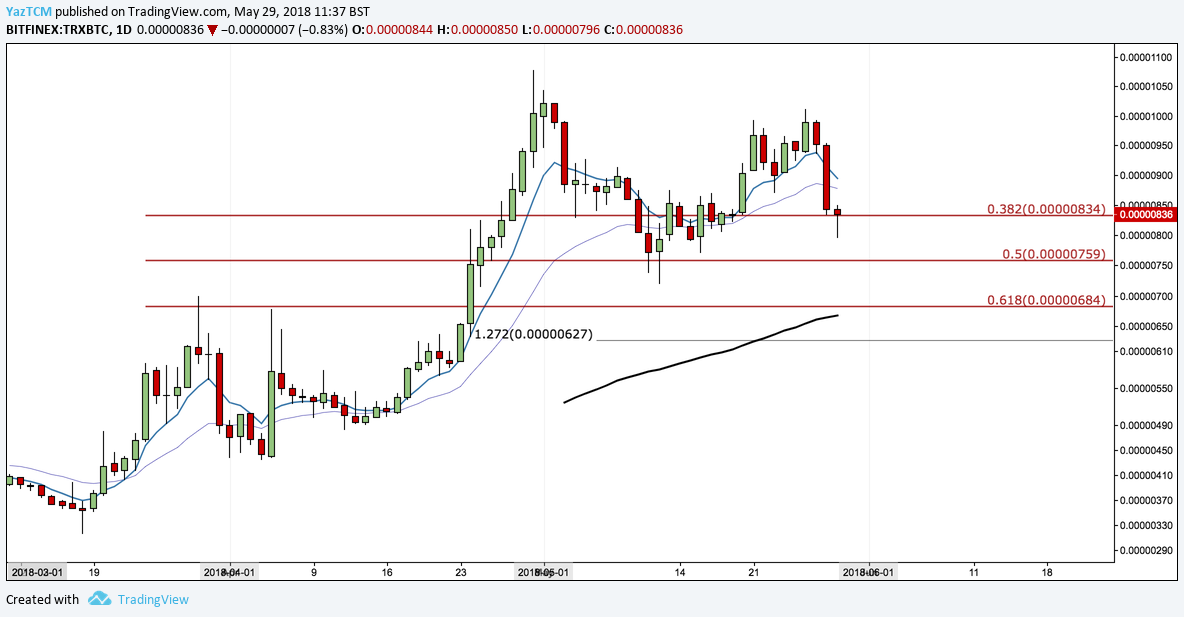
After a promising week, relative to the rest of crypto assets, Tron has finally returned some of it’s previous gains, succumbing to the woes of the overall cryptocurrency market.
Yesterday, Tron experienced a significant correction falling from a high of 955 SATS to a low of 834 SATS. This is approximately a 12% correction over the 24 hour period which can be considered as a pretty significant move. We can see from the chart above that after experiencing its drop, Tron found some from of support located around the .382 Fibonacci Retracement level at a price of 834 SATS.
Today, price is trading within and continuing to test this .382 Fibonacci Retracement area. If price continues along it’s bearish momentum, closing the day below the .382 Fib level (834 SATS), we can expect price action to continue lower and head toward the next level of Fibonacci support, the .50 Fib located at 759 SATS. After this price possibly could continue further lower toward the ‘Golden Ratio’ .618 Fibonacci Retracement zone located at 684 SATS.
Alternatively, if price can hold above the .382 Fib Ret zone, we may expect price to garner further bullish momentum in a hope to re-test the previous weeks’ high of around 1000 SATS.
TRX/USD
https://www.tradingview.com/x/vJHPmPSi/
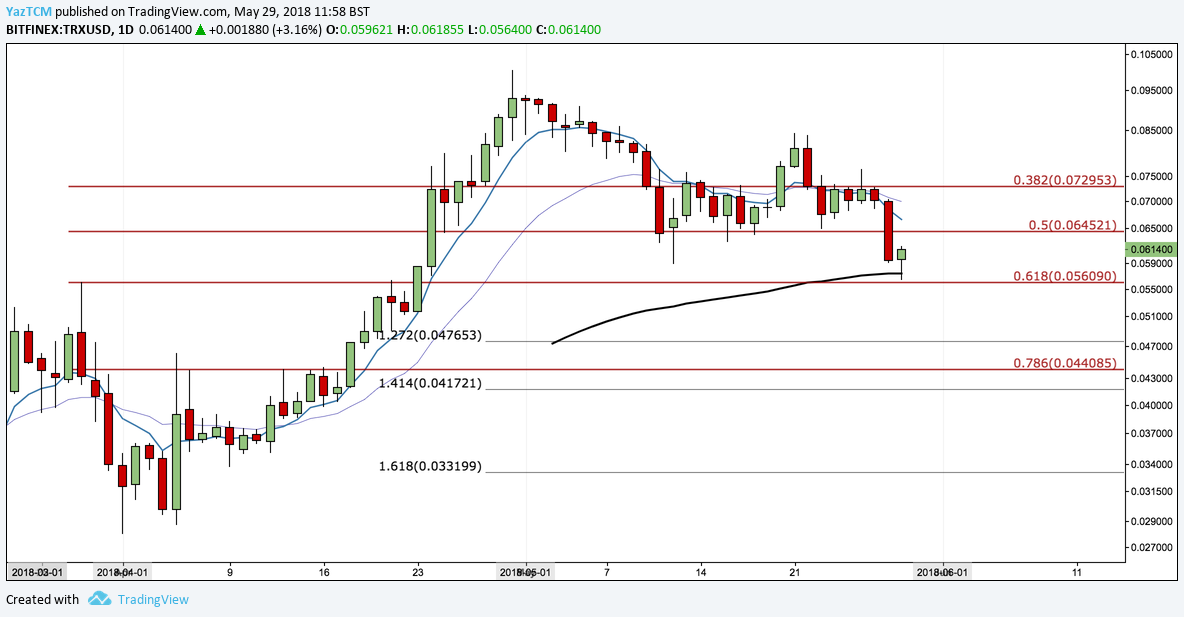
Tron has also experienced a level of significant downside pressure in its’ battle against the dollar.
With yesterday’s BTC/USD downside pressure, most of the cryptocurrency markets experienced some pivotal corrections and Tron was no exception to this case. Tron fell from it’s high yesterday of $0.070 to a low of $0.058. This was almost a 16% drop in its price over the 24 hour period.
This action saw price fall below our .50 Fibonacci Retracement support level, outlined in our last article, at a price of $0.064.
As of today, Tron continued its fall before approaching some support outlined by the following Fibonacci Retracement level, the .618, at a price of $0.056. After testing this support level, Tron has managed to rebound and is currently pushing $0.061 at the time of writing.
If Tron can continue in it’s short term attempt to make gains then we could expect price to head back toward the .50 Fib Retracement level, at $0.064, before attempting to re-test last weeks highs of $0.084.
Alternatively, if Tron eventually manages to break and close below the .618 Fibonacci Retracement level we could see price head lower toward the 1.272 Fibonacci Extension at a price of $0.0476. Also note that this is an area of previous strong resistance.
Short Term Overview
TRX/BTC
https://www.tradingview.com/x/mpycopbf/
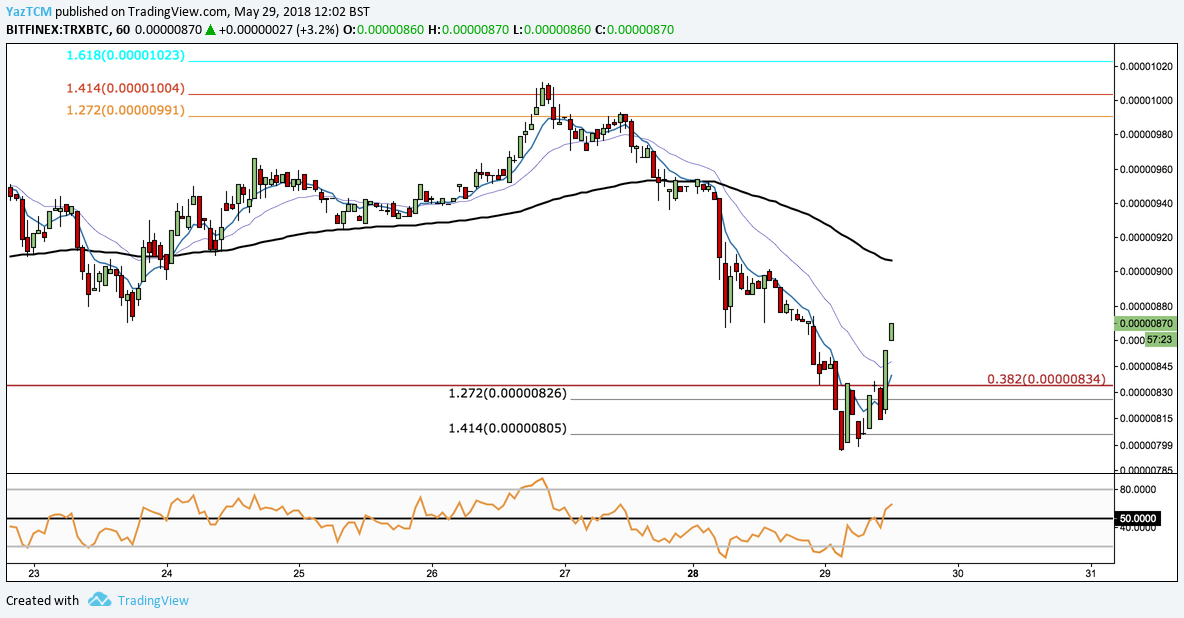
In our previous Tron TA article, we had outlined a potential upside target area at the 1.414 Fibonacci Extension level at a price of 1004 SATS. As we can see from the chart above, price action managed to creep up to our 1.414 Fibonacci Extension level before price had rolled over and experienced its significant correction yesterday.
Today, the price, against BTC, has managed to find a level of short term support located at a downside Fibonacci Extension at a price of 805 SATS. Price action is currently attempting to make some form of recovery as it battles to stay above the long term .382 Fibonacci Retracement of 834 SATS. If price can break and close above 874 SATS, previous support, then we may expect to see Tron continue to rise above 900 SATS and eventually beyond 950 SATS.
RSI has managed to creep up above the 50 handle, indicating that this potential bullish move may continue.
Alternatively, if prices fail to break and hold above 874 SATS, then we could expect price to continue lower, beyond the .382 Fibonacci Retracement and possibly breaking the region of sub 800 SATS. In this scenario, we may expect to see price head toward our 1.618 downside Fibonacci Extension target of 776 SATS before hitting the long term .5 Fibonacci Retracement of 759 SATS.
TRX/USD
https://www.tradingview.com/x/m8zeM9LO/
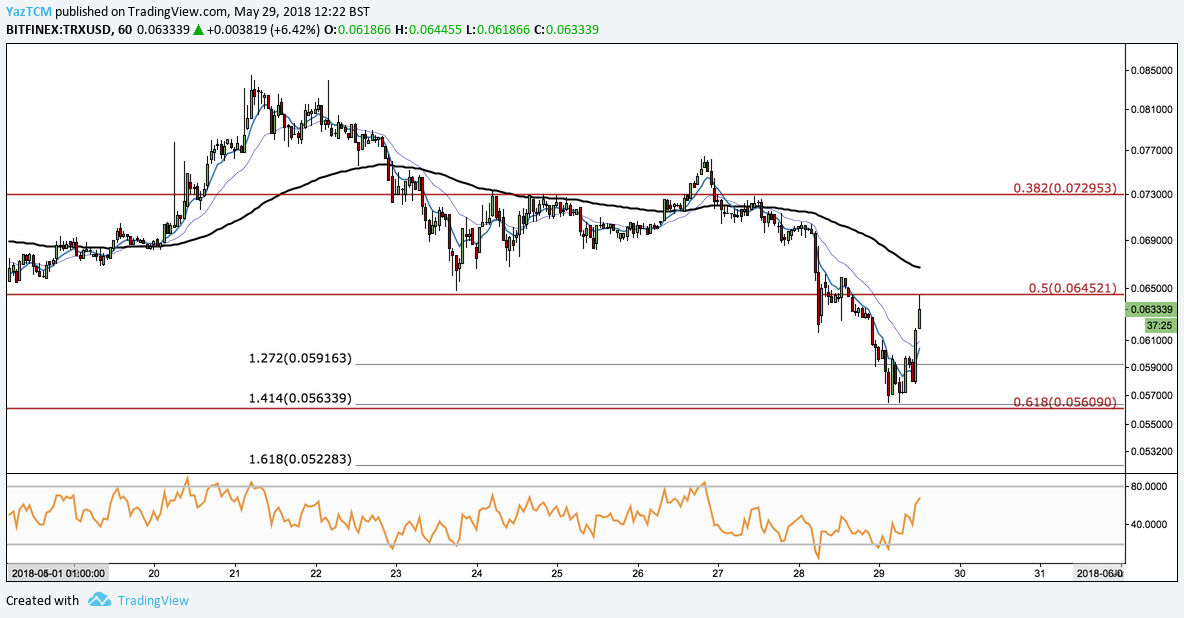
On the short-term TRX/USD charts, we can see that Tron has managed to found support at the long term .618 Fibonacci Retracement level and is currently trading between this level and the .50 Fibonacci Retracement level. This is a price of $0.056 and $0.064, respectively.
Currently, we can see price attempting to re-test the .50 Fib Ret level but failing to find momentum to break and close above this level at $0.064. If price action decides to roll over here and makes a close below $0.056 we could expect prices to continue lower toward the downside Fibonacci Extension level of 1.618 at a price of $0.052.
Alternatively, if price would indeed break and close above $0.064 then we may expect price to make attempts at previous areas of higher resistance located within the $0.072 region.

