
 Price Analysis #008 - Tron Shows Small Stabilisation in the Decline")
Tronix has experienced a small price decline totalling 1.83% over the past 24 hours. The cryptocurrency is currently trading at around $0.0219 and has shown some week on week stability as the 7 day price change is +0.11%.
Tron is a digital entertainment protocol that will allow users to publish,share and create content as well as owning exclusive rights to their own content. The system will also allow viewers to support their favourite content creators through the tipping system.
Tron is currently ranked at 12th position in terms of overall market cap across the entire industry with a total market cap ranking of $1.44 billion. It has suffered a price decline of 38% over the past 30 days and 69% over the past 90 days.
Let us continue to analyse price action over the short term for Tron.
Price Analysis
TRX/USD – SHORT TERM – DAILY CHART
https://www.tradingview.com/x/RhnroAna/
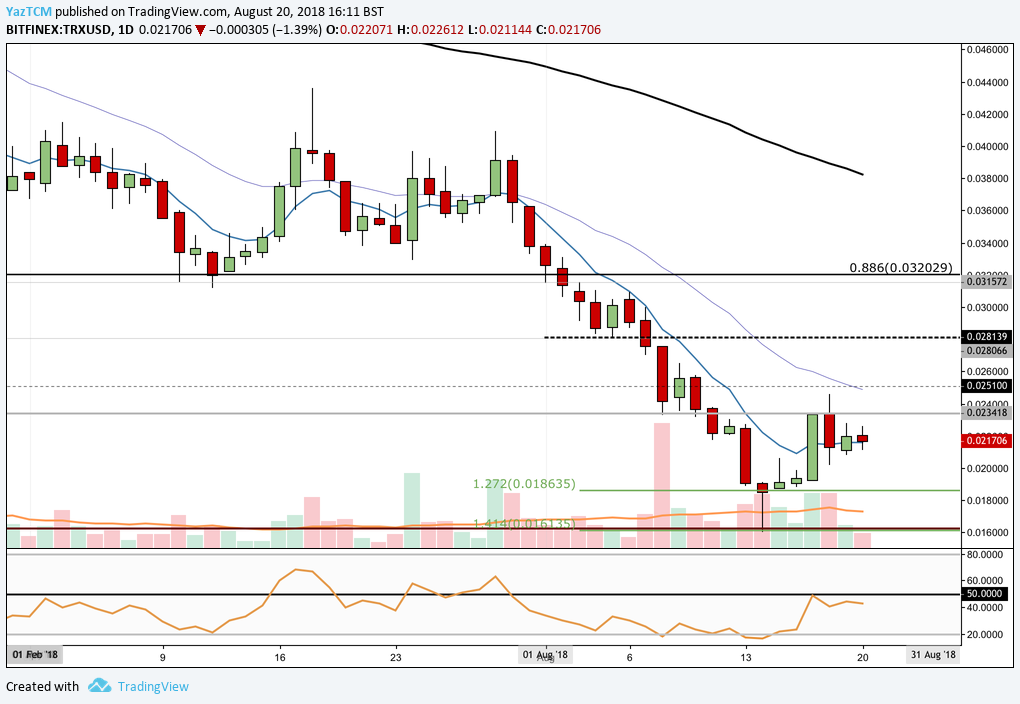
Since our last analysis, Tron has continued to drop through all of our expected support levels in a precipitous decline.
Price action was trading around $0.028 (at the black dotted line) and we had expected this level to hold as support due to previous price action, however, price action continued to decline and fell far beyond this support level.
We can see that price action continued to decline past long term support marked by March 2018’s price low at $0.023. We can also see that price action had found support at a short term downside 1.272 Fibonacci Extension level (drawn in green) priced at $0.0186. Price action was able to find support here and rebound.
It is important to highlight that price action, briefly, dipped below the 1.272 Extension Level to find support at a longer termed downside 1.272 Fibonacci Extension Level priced at $0.016. We can also see that the support was bolstered by the short term 1.414 Fibonacci Extension level was priced at the same level.
Price action has since rebounded and found resistance at March 2018’s low priced at $0.023. If the market can break up above this level we expect immediate resistance to be expected at the previous support handle marked by $0.028.
Alternatively, and bearish pressure is expected to be initially supported by the short term downside 1.272 Fibonacci Extension level priced at $0.018. Further support below this level is expected at the downside 1.414 Fibonacci Extension level priced at $0.016.
Let us quickly analyse price action much more closer on the hourly time frame to highlight any short term support and resistance zones.
TRX/USD – SHORTER TERM – HOURLY CHART
https://www.tradingview.com/x/EnqYzKwk/
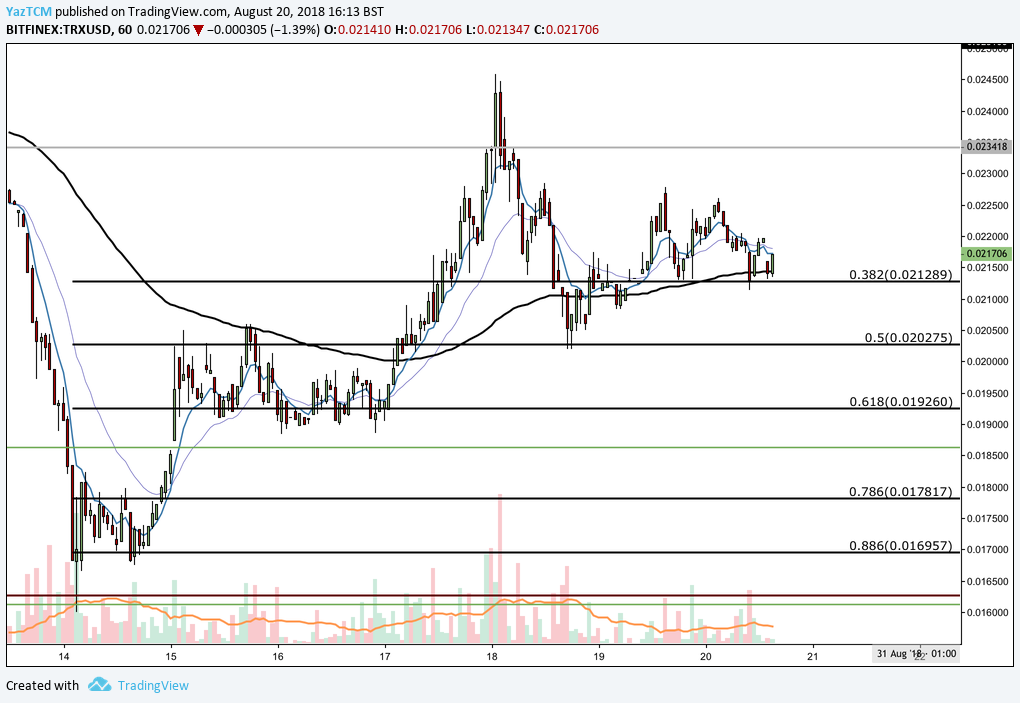
Analysing price action from the benefit of an hourly chart, we can see that the recent bullish price action has pushed the market from a low of $0.016 on the 14th of August to a high of $0.0245 on the 18th of August. Those that bought at the low can be happy about receiving a 50% price increase from low to high in this bullish move.
We can see that after placing the high, price action rolled over and began to decline for a few hours. It continued to decline until it found support marked by the .5 Fibonacci Retracement level priced at $0.020. Price action has climbed slightly higher since this point and is currently trading at support at the .382 Fibonacci Retracement level priced at $0.021.
If the market can break the high placed at $0.0245 we can expect the bullish scenario outlined above to play out.
Alternatively, in the short run, if the market slips we can expect support at the .5 Fibonacci Retracement priced at $0.0202 once again. Further support can be expected at the .618 Fibonacci Retracement level priced at $0.01926. A deeper Retracement would see support at the $0.017 and $0.0169 handles.

