
 Technical Analysis #005 - Tron Breaks Below Previous Range During Bloody Sunday")
The cryptocurrency market has recently experienced a few days of extreme bearish pressure and Tron has been no exception to this.
Over the past three days, since the start of Sunday, TRX has dropped 19.72% in price. Over the past 7 trading days, at the time of writing, Tron is down by a total of 22.73%.
The cryptocurrency is currently trading at a price of $0.0462 and is ranked 10th in terms of overall market cap across the board, with a total market cap value of $3 billion.
The market has recently broken through its previous trading range that it was trapped between for over two weeks, as it approaches a new area of support around $45.
The cryptocurrency was founded by Forbes Asia 30 under 30 most influential people, Justin Sun. Tron aims to become a decentralised entertainment content sharing platform where content creators own all rights to their work.
The Tron team have recently released their mainnet last month with a token migration said to be occurring near the 25th of June. The support from exchange continue to grow for Tron as Binance has recently listed a new TRX/USDt market bringing the total of TRX markets well over 100.
Let us take a look at price action of TRX over the recent term.
Price Analysis
TRX/USD – SHORT TERM – DAILY CHART

https://www.tradingview.com/x/CCtX7llj/
Looking at the charts above, we can see that TRX has broken out of the range that we had highlighted in our previous analysis, here. We had expected the .618 Fibonacci Retracement at $0.056 to hold, however, the markets took an unexpected steep dive on Sunday and broke through the .618 Fibonacci Retracement.
We can also see that yesterday, on Monday, the market had a period of further declining prices as price action fell, briefly, below $0.040. Price is currently trading at $0.045 as it makes its way toward the nearest level of support located at the the .786 Fibonacci Retracement at $0.044.
Prices within the market are very volatile right now, meaning that they can move a great deal in terms of percentage in a very short space of time, as seen on Bloody Sunday and the following Monday. We hope for the market to find some form of support between $0.044 and $0.040, both areas of previously strong support.
The technical indicators are not providing much favour towards the bullish players within the market. The RSI is trading within extreme oversold conditions as it hovers below the 20 handle. With RSI in this area we could expect the selling to continue, however, at a slower pace as RSI does not tend to stay in oversold conditions for very long. To add to this bearish pressure, the 7 day EMA has also recently crossed below the 100 day SMA indicating a possible long term shift toward the downside within the market.
TRX/BTC – SHORT TERM – DAILY CHART
https://www.tradingview.com/x/zDjcE4qR/
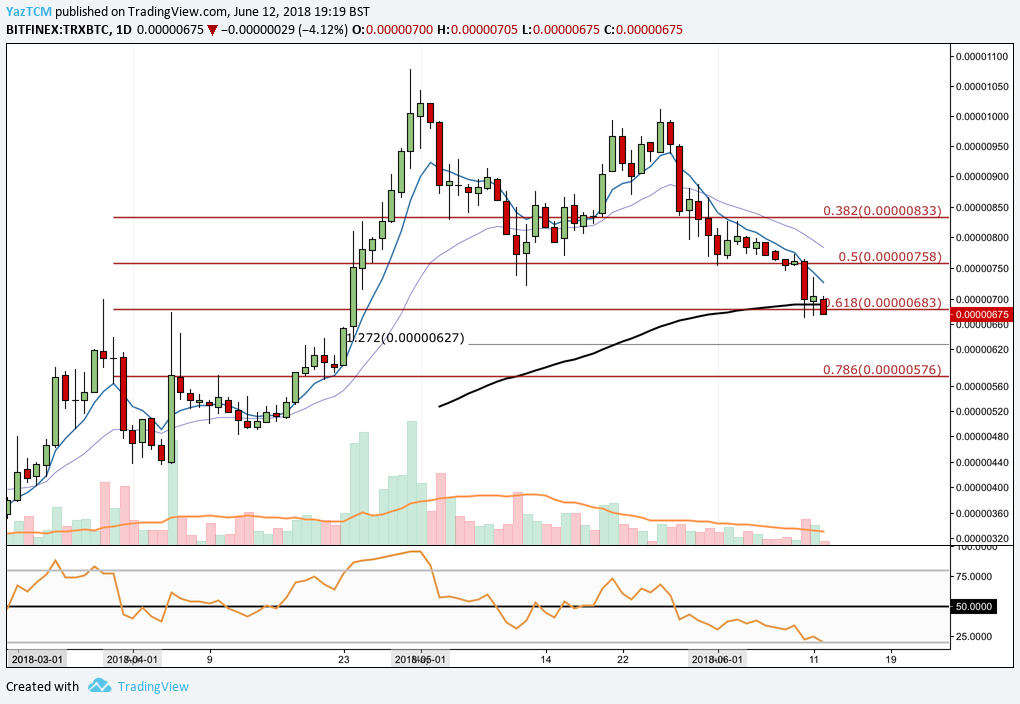
Looking at TRX against BTC, we can see that Bloody Sunday caused price action to break below the .50 Fibonacci Retracement level located at 758 SATS.
TRX is currently trading hands at a price of 675 SATS as it finds support around the .618 Fibonacci Retracement located at 683 SATS. This area of support is also bolstered by the 100 day moving average, as price action battles to stay above this moving average.
If price action holds above the .618 Fibonacci Retracement, then we may be able to see bulls re-entering the market. It would require significant volume and momentum but the bulls may be able to shift prices back toward the .50 Fibonacci Retracement at 758 SATS.
Alternatively, if prices continue on this downward trajectory and close below the .618 Fibonacci Retracement then our next levels of identified support can be seen at 627 which is a 1.272 Fibonacci Extension of the initial swing leg down in early May. Following this, our next area of support comes in at 576 SATS which is the .786 Fibonacci Retracement level.
The technical indicators are, once again, showing no promise toward the bulls. The RSI is approaching extreme oversold conditions at 20 and the 7 day EMA and 21 day EMA are in a steep decline.
CONCLUSION
With such a big market cap, we cannot see TRX falling too much further with such exciting developments ahead. However, cryptocurrency markets are extremely volatile so we can not rule out another significant price decrease such as the one seen on Bloody Sunday.

