
 Technical Analysis #008 - Tron Reaches 1.618 Fibonacci Extension Support")
Tron has experienced a small 1.25% price hike over the past 24 hours of trading. This comes after a sharp 13% price drop over the past 7 trading days. Tron is currently exchanging hands at a price of $0.0297 and has recently lost its 11th position ranking in terms of overall market cap across the entire industry. Tron is now ranked in 12th place after being overtaken by Ethereum Classic. Tron has a total market cap of $1.95 billion.
Justin Sun has recently announced over the last day that the Chinese Blockchain giant known as Raybo will be running for a Tron Super Representative position. The Super Representatives secure the blockchain and are burdened with the responsibility to maintain all transactions on the network.
Tron has also recently had a global meeting where the Tron teams in the Western Hemisphere met up with those in the Tron team belonging to the Eastern Hemisphere. This will bring the members of both factions closer together as the team count is currently at 300 members.
Justin Sun has also recently announced that since the mainnet launch there have been over 100 thousand mainnet accounts that have been created on the mainnet network.
Let us continue to analyse price action for Tron.
Price Analysis
TRX/USD – SHORT TERM – DAILY CHART
https://www.tradingview.com/x/zxjYfzsJ/
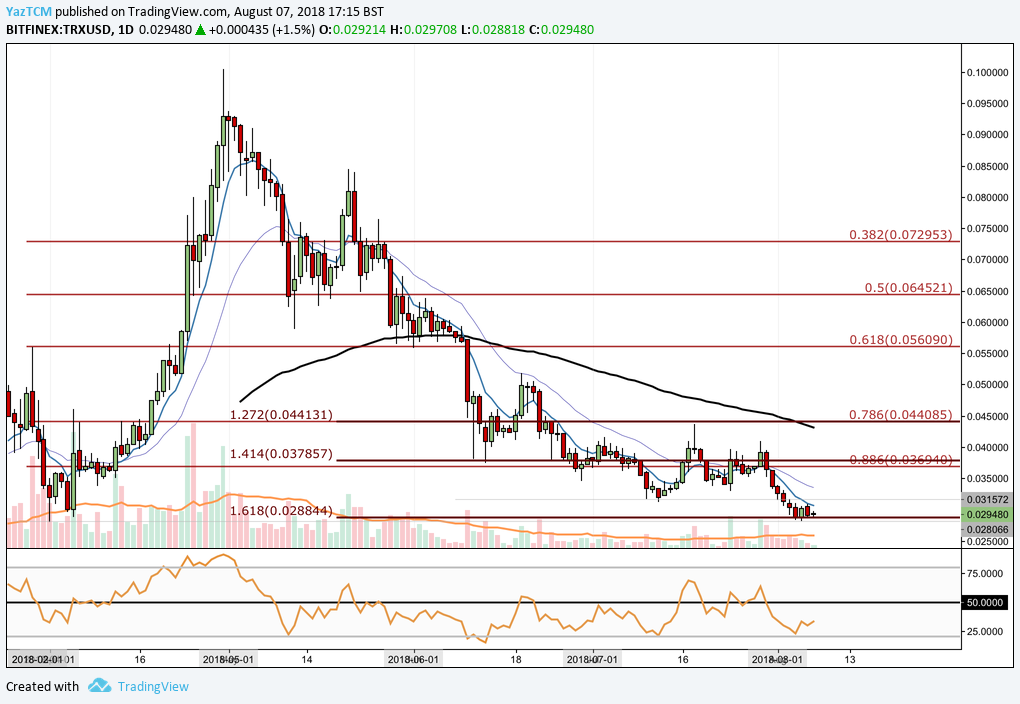
Analysing the market from the short term viewpoint above, we can see that TRX had experienced a significant bullish run when the market started from a low of $0.028 on the 1st of April 2018 and extended to an all time high of $0.1 on the 30th of April 2018. In this 30 day period, price action had risen a total of 250% from low to high.
We can see that the market fell from its high in May, initially finding support at the .618 Fibonacci Retracement priced at $0.056 toward the end of the month. This Fibonacci Retracement is measured from the entire bullish run aforementioned.
However, the market was not able to hold at this level and fell further lower during June, dropping below the 100 day moving average to find support at the .886 Fibonacci Retracement priced at $0.036.
We can see that, as of August, the market has now completed a full 100% retracement of the bullish run mentioned above, falling to the initial started point seen during April at $0.028. This price level of support was bolstered by a 1.618 Fibonacci Extension which was priced in the exact same are.
Let us continue to highlight any potential support and resistance areas within the market.
Tron is expected to hold this support level at $0.028. The price level has provided a critical pivotal point previously and is expected to continue to do so. In the unlikely event that price action does slip below $0.028 we expect immediate support to be located at March’s price low at $0.025.
Alternatively, if the bulls can garner enough momentum from this level we expect immediate resistance to be located at the .886 Fibonacci Retracement priced at $0.036. Further resistance above this level is expected at the .786 Fibonacci Retracement priced at $0.044.
This level will require significant momentum to overcome due to the 100 day moving average being closely correlated within this area. A convincing break above $0.044 would cause Tron to leave the range-bound trading condition that it has been trading for the previous 5 weeks and, hopefully, transition the market into a bullish market.
The technical indicators within the market are heavily favouring the bears as the RSI trades well below the 50 handle. This indicates that the bears are in complete control. If we are to expect some bullish momentum at this support level we will require the RSI to break back above the 50 handle and continue to slowly rise.
Similarly, the moving averages are all trading in bearish conditions. The shorter moving averages are all lined below the longer moving averages indicating that the prevailing trend is downward.
For a sign that the bearish momentum is fading we will look for the 7 day EMA (blue line) to cross above the 21 day EMA (purple line) to form a bullish crossover signal that could suggest that the bears are beginning to take control in the short term.

