
 Technical Analysis #002 - Stellar trading strongly at support; good times ahead_")
Stellar has seen a price decline totalling 4.09% over the past 24 hours of trading. This comes after Stellar, and the rest of the cryptocurrency market, managed to rebound over 10% over in one trading session, yesterday. Stellar is currently trading at $0.21, at the time of writing, after suffering a 12.57% price drop over the past 30 trading days.
Stellar has often been described as “Ripple….but for the people”. It enables low-cost interbank transfers across countries in less than 5 seconds. It is a finance platform that connects individuals, institutions and payment systems. Ripple, on the other hand, is designed primarily for financial institutions and banks to be used by.
Stellar Lumens is currently ranked in 6th position in terms of overall market cap across the entire industry. It has a total market cap value of $4.07 billion. The 48 month old coin, XLM, has suffered a precipitous price drop toalling 32% over the past 90 trading days.
Let us continue to analyse price aciton over the short term.
Price Analysis
XLM/USD – SHORT TERM – DAILY CHART
https://www.tradingview.com/x/PnSXYqH5/
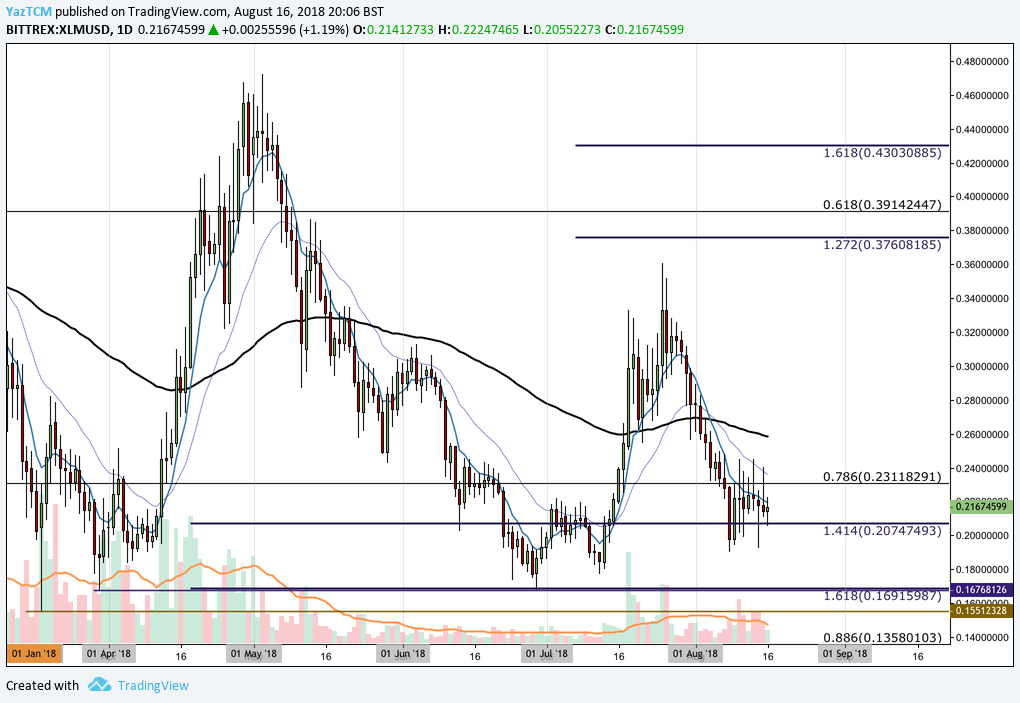
Analysing price action from the chart above, we can see that XLM had experienced a sharp price increase totalling 178% in April. Price action started from a low of $0.16 on March 31st and extended to a high of $0.47 on May 3rd.
We can see that after placing the high, price action went on to decline rapidly in May and June. Price action completed a 100% Fibonacci Retracement of the bullish run toward the end of June as price action returned to the low of $0.16 once again. This support level was bolstered by a 1.618 Fibonacci Extension level priced at $0.16.
Throughout July, price action went on to make another bullish run before retracing to where the market currently sits, at support marked by the downside 1.414 Fibonacci Extension level priced at $0.20.
Let us continue to analyse this second bullish run a little closer and highlight any potential support and resistance zones.
XLM/USD – SHORTER TERM – DAILY CHART
https://www.tradingview.com/x/Ys9BkC36/

Analysing the market from a closer perspective, we can see that the bullish run in July commenced when price action started from a low of $0.16 on June 29th and extended to a high of $0.36 on July 25th. This was a price increase totalling 115% from low to high.
We can see that as August commenced trading, the market decline rapidly. However, the bloodbath seemed relatively muted compared with the rest of the altcoin industry. We can see that XLM fell below the 100 day moving average and continued to fall until support was found at the short term .886 Fibonacci Retracement level priced at $0.19. Each time price action approached this area, it was rejected heavily.
Price action is currently trading at support marked by the short term .786 Fibonacci Retracement priced at $0.20. This support area is bolstered by the downside 1.414 Fibonacci Extension mentioned above.
If the market can gather momentum at this support level and rally, we expect immediate resistance to be located at the short term .618 Fibonacci Retracement priced at $0.24. Further resistance is expected at the .382 Fibonacci Retracement priced at $0.28.
Alternatively, if the market falls below $0.20, we expect immediate resistance to be a the .886 Fibonacci Retracement priced at $0.19. Further support can be expected at $0.16 which is June 2018’s lows.
The technical indicators are still favouring the bears at this moment in time as the RSI trades beneath the 50 handle. However, it has been rising over the past few sessions indicating that the bears may be losing momentum. If a sustained break can be made above the 50 handle this will signal that the bulls are starting to gain some form of traction within the market.
, and Stellar (XLM) Price Analysis – Recovery Expected Above Major Support Levels")
 and Stellar (XLM) Weekly Price Performance Overview")
