
 Price Analysis Currency Rides the Bearish Wave")
XLM/USD Price Medium-term Trend: Bearish
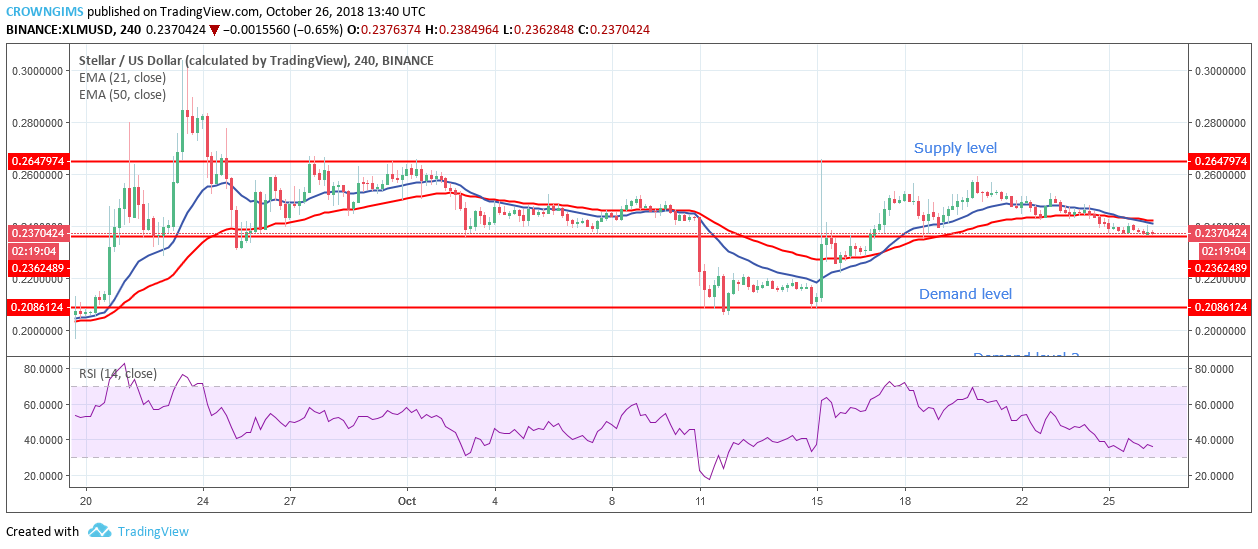
Supply levels: $0.26, $0.28, $0.30
Demand level: $0.23, $0.20, $0.16
Stellar is in bearish trend on the 4-Hour chart. The bearish trend started on October 20, when the bears entered the market with their pressure pushed down the price from the supply levels of $0.26 to demand levels of $0.23. The bears were in control of the market and the price has been decreasing gradually with the formation of bearish candles towards the demand level of $0.23.
XLM is trading below both 21-day EMA and the 50-day EMA. The 21-day EMA has crossed the 50-day EMA downside. It suggests a continuation of the downtrend movement. However, the RSI 14 is above 30 levels with signal lines pointing to the south which indicate selling signal.
In case the bears increase their momentum and break the demand level of $0.23, it will expose the coin to the demand level of $0.20. On the other hand, if the bulls defend the demand levels of $0.23, the XLM price will rally to the north and the bulls will take over the control of the market.
XLM/USD Price short-term Trend: Bearish
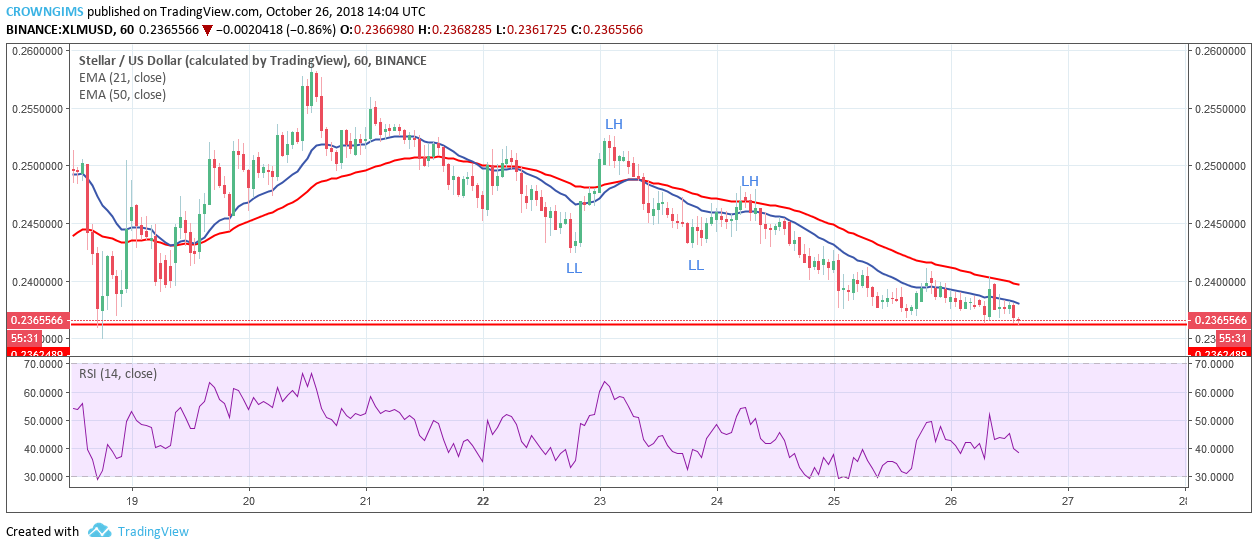
Stellar continues its bearish trend on 1-Hour chart. XLM price has been falling for more than three days with the formation of more bearish candles and the market has been making Lower Low (LL) and Lower High (LH). Today, the price is on the demand level of $0.23. Should the demand level of $0.23 holds and the bulls increase their momentum the price will rally to the north and the trend may change to an uptrend.
The coin is trading below 21-day EMA and 50-day EMA. The two EMAs were separated from each other which indicate downtrend is ongoing. In addition, RSI 14 is above 40 levels and its signal lines point to the south indicates sell signalling.

, and Stellar (XLM) Price Analysis – Recovery Expected Above Major Support Levels")
 and Stellar (XLM) Weekly Price Performance Overview")
 Price Analysis – June 17, 2019")