
![Stellar [XLM] Price Analysis: Bulls Struggle to Break Above $0.24](https://zycrypto.com/wp-content/uploads/2018/10/Stellar-XLM-Price-Analysis-Bulls-Struggle-to-Break-Above-0.24.png "Stellar [XLM] Price Analysis Bulls Struggle to Break Above $0.24")
XLM/USD Medium-term Trend: Bullish
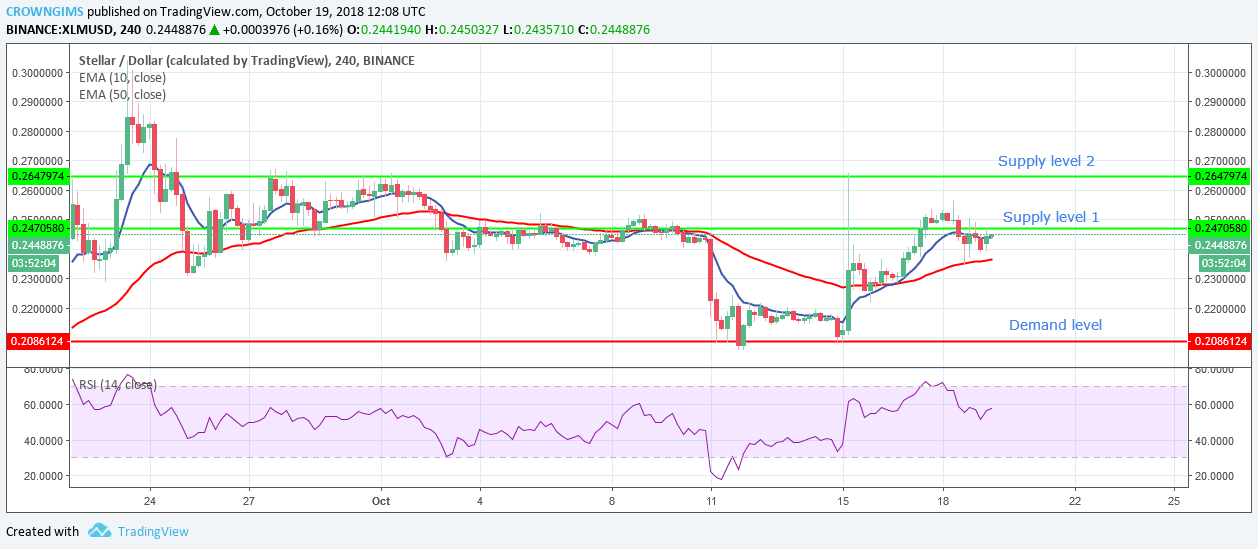
Supply levels: $0.24, $0.26, $0.28
Demand level: $0.20, $0.18, $0.16
Stellar is in bullish trend on the 4-Hour chart. XLM broke down the supply level of $0.24 with a strong bearish candle. The bulls interrupted the bearish trend at the demand level of $0.20 with strong momentum; confirmed with the formation of a strong bullish candle. Price has been increasing gradually with the formation of bullish candles towards the supply level of $o.24. The bulls were in control of the market yesterday.
XLM is trading above both 10-day EMA and the 50-day EMA. The 10-day EMA has crossed the 50-day EMA upside. It suggests a continuation of an uptrend movement. However, the RSI 14 is above 55 levels with signal lines pointing to the north which indicate buying signal.
In case the bulls increase their momentum and break the supply level of $0.24 with the formation of a bullish engulfing candle on the 1-Hour chart the traders can take long trade setup. On the other hand, if the bears defend the supply levels of $0.24, bears will take over the control of the market.
XLM/USD Price short-term Trend: Ranging

Yesterday, Stellar was in a bearish move which was the retracement of the supply level of $0.24 it broke up, after the completion of the retracement, Stellar entered ranging mode.
Today, the price is ranging below the supply level of $0.24. Should the supply level of $0.24 holds and the bears increase their momentum the price will go back to downtrend.
The coin is on the 10-day EMA and 50-day EMA. The two EMAs were interlocked with each other which indicate consolidation is ongoing. However, RSI 14 is below 60 levels and its signal lines point to the south indicates sell signaling.
, and Stellar (XLM) Price Analysis – Recovery Expected Above Major Support Levels")
 and Stellar (XLM) Weekly Price Performance Overview")
