
 May Result in a Strong Bullish Signal")
XLM/USD Medium-term Trend: Bearish
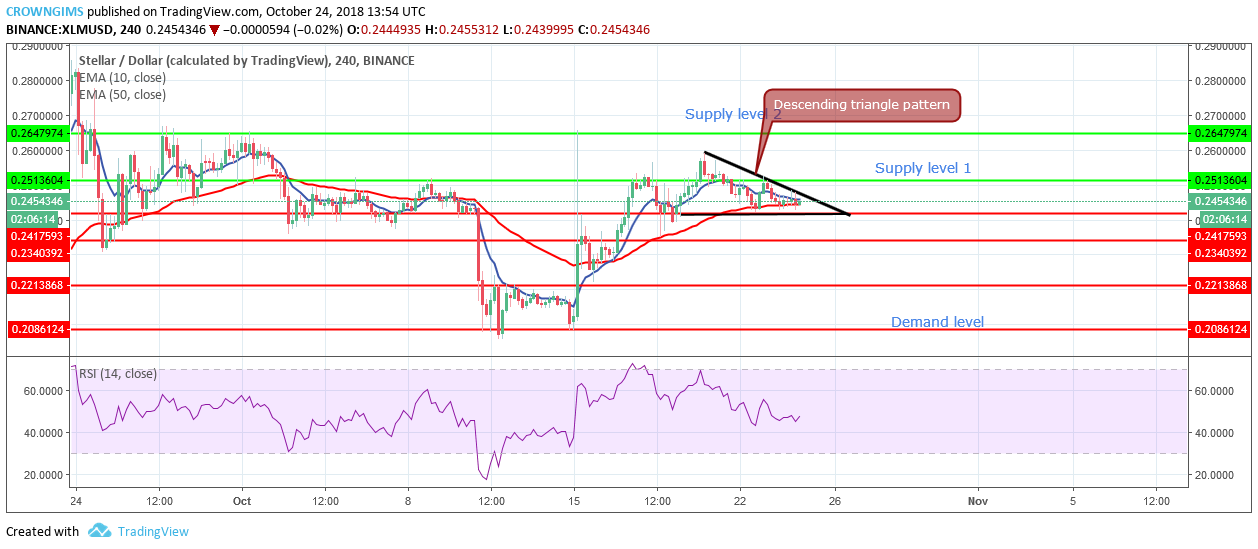
Supply levels: $0.25, $0.26, $0.28
Demand level: $0.24, $0.23, $0.22
Stellar is bullish on the 4-Hour chart. On September 18 the bears increased their momentum and bottomed the XLM price at the demand level of $0.23. Further decrease in price was rejected by the bulls which resulted in forming bullish pin bar which rallies the coin to the north where it broke the supply level of $0.24. Top tweezers candle was formed to reject the price increase by the bears. The price started decreasing from the top of supply level of $0.25 to the demand level of $0.24.
The market has formed “descending triangle” pattern which connotes the high probability of the XLM price break out to the south. Although a breakout at the upper trend resistance line area will be a good buying opportunity or a breakdown at the lower trend support area will be a selling opportunity.
XLM is trading between both 10-day EMA and the 50-day EMA. It suggests a price consolidation is ongoing. However, the RSI 14 is above 40 levels with signal lines pointing to the north which indicate buying signal.
XLM/USD Price short-term Trend: Bearish
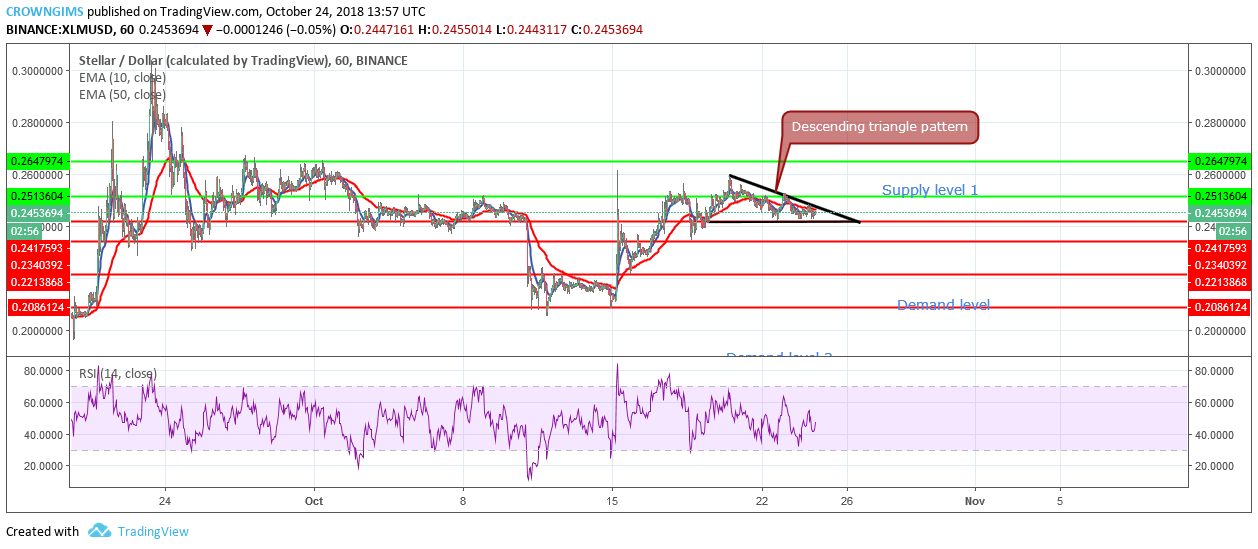
On the 1-Hour chart, the coin is bearish. Just after the rejection of an increase in the price of Stellar. XLM started moving down gradually to the support level of $0.24.
Today, the price reached the upper supply level of 0.24 and the XLM price has formed “Descending triangle” pattern, in which breaking out from either up or down is a profit-making action.
Should the bears increase their pressure and there is a break out from the bottom trend line of the triangle the price may break the demand levels of $0.24, $0.23 and expose $0.22.


