

Neo has seen a small 2.8% price decline over the past 24 hours of trading. The cryptocurrency is currently exchanging hands at a price of $18.43 after seeing a small 1.61% price decrease over the past 7 trading days.
Neo, the cryptocurrency developed by the company OnChain continues its mission to become the number 1 ranked cryptocurrency by 2020. Neo presents a platform that represents a smart economy that incorporates digital assets, digital identity and smart contracts.
The distrusted network for the smart economy can currently process over 1000 TPS (transactions per second) at this moment in time, significantly higher than its rival’s TPS from Ethereum which can currently handle between 15-21 TPS.
Neo is currently ranked in 14th position in terms of overall market cap across the entire industry. It has a total market cap value of around $1.20 billion after the cryptocurrency sees a 49% price decline over the past 90 trading days. The 25 month old cryptocurrency is currently trading at a value that is 88% lower than its all time high price.
Let us continue to analyse price action for NEO over the short term and highlight any potentials support and resistance areas.
Price Analysis
NEO/USD – SHORT TERM – DAILY CHART
https://www.tradingview.com/x/n1IVUeuI/
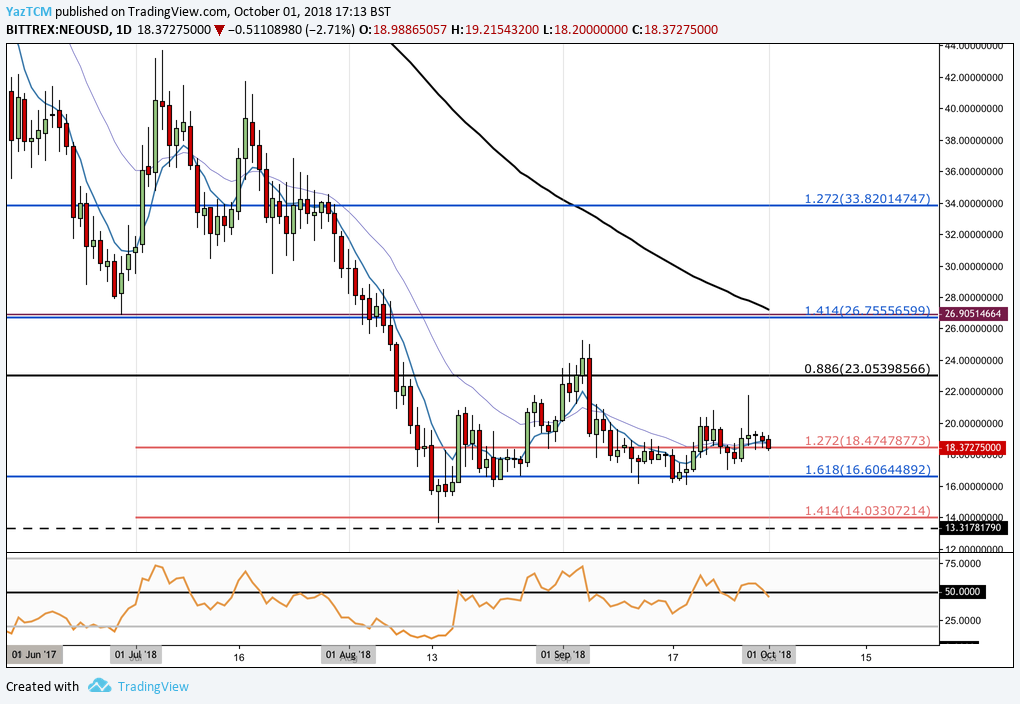
Analysing the market from the short term perspective above, we can see that Neo has seen some form of stabilisation over the past 2 months from its previous down trend.
After hitting support at the downside 1.414 Fibonacci Extension level (drawn in red) priced at $14.03 during August 2018, price action reversed and began to ascend. We can see that during August and September the longer termed downside 1.618 Fibonacci Extension level (drawn in blue) priced at $16.60 had provided significant support. Each time the market approached this level it was supported heavily.
The market is now currently trading at support provided by the short term downside 1.272 Fibonacci Extension level priced at $18.47. If the bears continue to push price action lower, we can expect immediate support to be located at the downside 1.618 Fibonacci Extension level (drawn in blue) priced at $16.60.
Further support located below this level can then be expected at the psychological round number handles of $16, $15.50 and $15. If the bears push the market below $15 then the next level of significant support can be expected at the downside 1.414 Fibonacci Extension level (drawn in red) priced at $14.03 once again.
Alternatively, if the bulls can regather momentum and push price action higher, we can expect immediate resistance to be located at the psychological round number handle of $20. Further resistance above this level can then be expected at the long term .886 Fibonacci Retracement level priced at $23.05.
If the bulls can persist even higher, we can expect more resistance to be located at the previous downside 1.414 Fibonacci Extension level (drawn in blue) priced at $26.75. This area of resistance will require significant momentum to overcome due to the 100 day moving average hovering closely within this price area further adding to the expected resistance here.
The technical indicators within the market have recently swung into the favour that favours the bears ever so slightly. The RSI has dipped underneath the 50 handle indicating that the bears are now currently in control of the momentum within the market.
If we would like to see some positive gains within this market we would need to see a break of the RSI above the 50 handle to indicate that the bulls are back in possession of the market momentum.
, and Stellar (XLM) Price Analysis – Recovery Expected Above Major Support Levels")
 and Stellar (XLM) Weekly Price Performance Overview")
