

Neo has suffered a 3.54% decline in price over the past 24 hours of trading. The cryptocurrency is currently exchanging hands at a price of $17.21 after suffering a further 7.13% price decline over the past 7 trading days.
Neo is a cryptocurrency dedicated to finding a solution to the scalability issues plaguing Ethereum. It allows for decentralised applications and smart contracts to be executed on its blockchain leading to many calling it “China’s Ethereum”.
Neo is currently ranked at 14th position in terms of overall market cap across the entire industry. It has a total market cap value of $1.12 billion after the 24 month old coin suffers a 57% price decline over the past 90 trading days.
Let us continue to analyse price action for Neo over the medium term and update our support and resistance areas.
Price Analysis
NEO/USD – MEDIUM TERM – DAILY CHART
https://www.tradingview.com/x/8hexcmit/
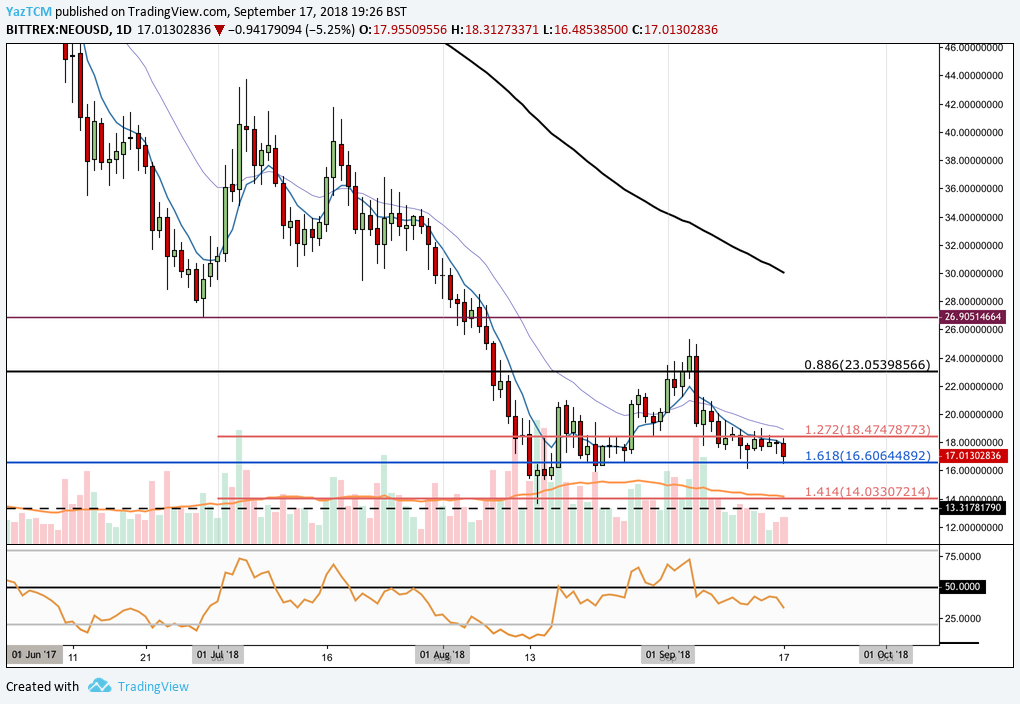
Analysing the market from the medium term perspective above, we can see that Neo has descended below all of our expected support price levels. During August, Neo had experienced a particularly rough time as the market dropped below the support expected at the $20 handle to trade to a low close to $14.
We can see that price action continued to fall in August 2018 until finding support at a short term downside 1.414 Fibonacci Extension level priced at $14.033. The market had found support at this area and reversed.
We can see that price action is now trading at support identified by a downside 1.618 FIbonacci Extension level (drawn in blue) priced at $16.60. If the bearish action continues, we can expect the market to be supported at the $16.60 handle.
If price action continues even further lower, then support can be expected at the psychological round number handle of $16 followed by the short term downside 1.414 Fibonacci Extension level priced at $14.033. Further support below this can then be expected at September 2017 lows at $13.31.
ALternatively, if the bulls can regather momentum at this support level, we expect immediate resistance to be located at the downside 1.272 Fibonacci Extension level priced at $18.47. If the bulls can push up above this level then we expect further resistance to then be located at the .886 Fibonacci Retracement handle priced at $23.05.
The technical indicators within the market are currently favouring the bears at this moment in time. The RSI is trading below the 50 handle, indicating that the bears are still in control of the momentum within the market which means it could still be heading lower.
Let us continue to analyse price action at a closer tie perspective for Neo.
NEO/USD – SHORT TERM – 4HR CHART
https://www.tradingview.com/x/2fJIBeWV/
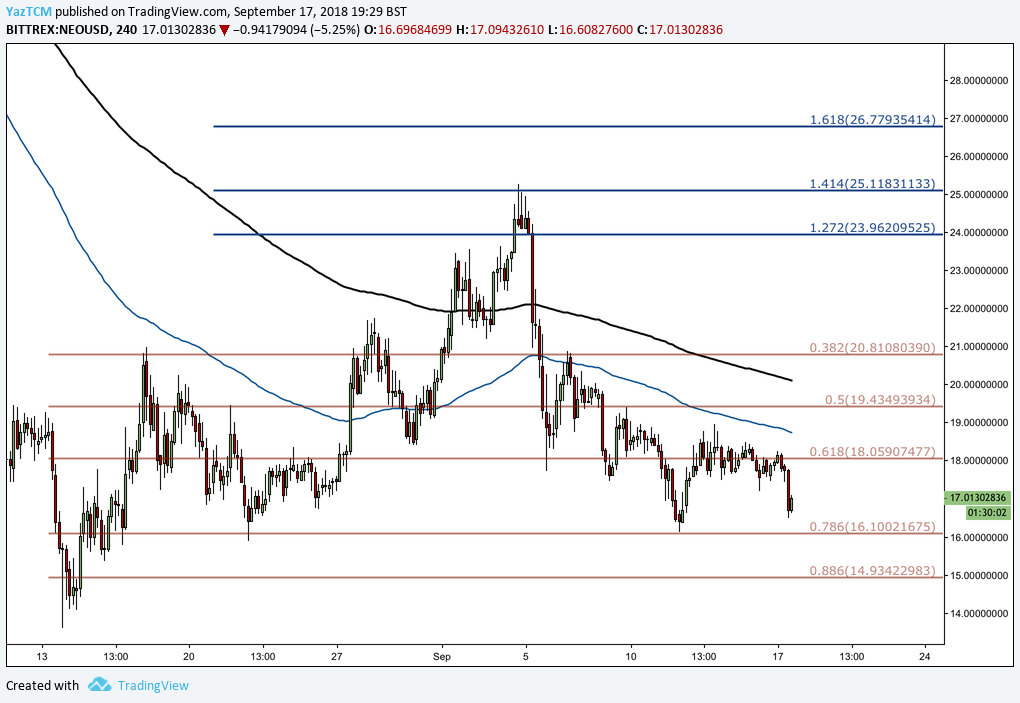
Analysing price action from the short termed perspective above, we can see that the market had recently experienced some bullish momentum as price action started from a low of $13.60 on the 14th of August and extended to a high of $25.27 on the 4th of September. This was a price increase totalling 85% from low to high.
Since placing the high, price action has rolled over and declined. We can see that it has recently found support at a short term .786 Fibonacci Retracement level priced at $16.10. If the bearish momentum continues we expect further support to be located at this level. If price action can penetrate below this then support located below will be expected at the .886 Fibonacci Retracement level priced at $14.93.
ALternatively, if the bears can regather momentum at this level and push higher, we expect immediate resistance at the $18 handle. Further significant resistance above this level can then be expected at the .382 FIbonacci Retracement level priced at $20.81. IF price action can continue even higher, then further resistance will be expected at the 1.414 Fibonacci Extension level priced at $25.11.


