

The majority of the cryptocurrency markets have taken a tumble today as Bitcoin falls further lower, NEO has been no exception. The cryptocurrency Neo has fallen by a total of 18% over the past 24 hours trading as it currently trades around $22. This price drop has been extended to a 25.98% over the past 7 trading days.
Neo was developed by the Shanghai blockchain research company, OnChain and was rebranded from AntShares in June 2017. Neo was created to address the scalability issues surrounding current blockchain solutions and can boast about being able to process upto 1000 TPS (transactions per second).
It is intended to be the new smart economy platform by combining digital assets, digital identities and smart contracts. As a competitor to Ethereum it can run decentralised applications at a large commercial scale.
Neo is currently ranked in 15th position in terms of overall market cap across the entire industry with a total market cap value of $1.43 billion.
Price Analysis
NEO/USD – LONG TERM – DAILY CHART
https://www.tradingview.com/x/vMFAwrvK/
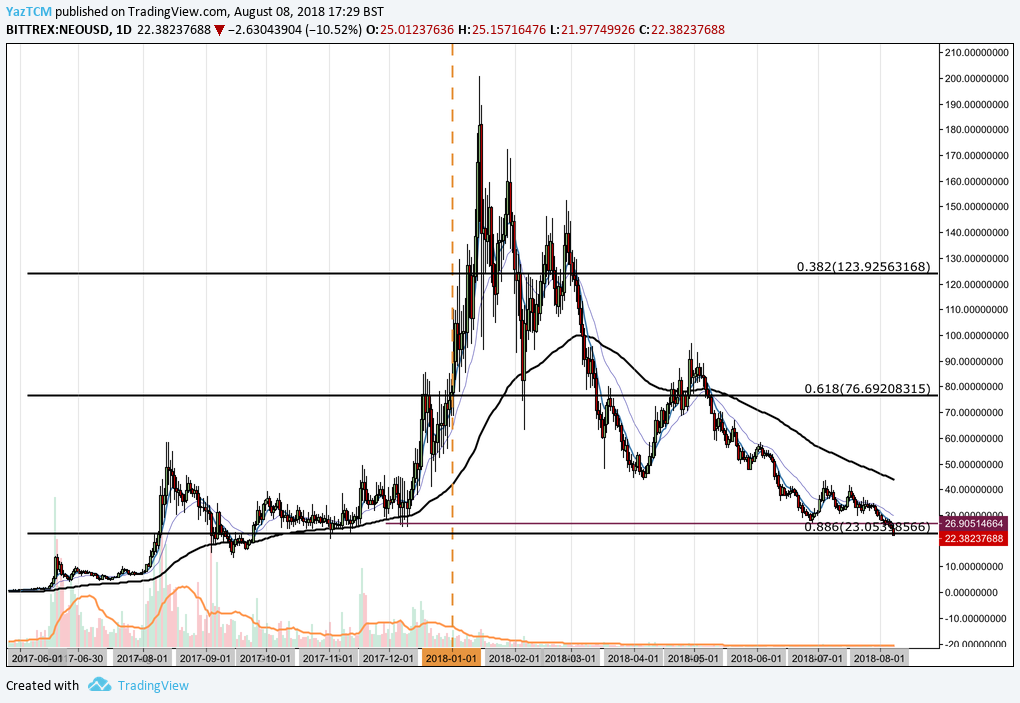
Analysing the market from the long term perspective above, we can see that during 2017 Neo had experienced an incredible bullish run as price action started from a low of $1.49 on the 16th of June and extended to an all time high of $181.65 on the 15th of January 2018. This was an unprecedented price increase totalling 23,000% from low to high.
We can see that after placing the all time high, the market rolled over, initially finding support at the .618 Fibonacci Retracement priced at $76 during February 2018. This Fibonacci Retracement is measured from the entire bullish run aforementioned.
As the trading year progressed the market continued to fall, eventually finding support at where it is currently trading at the .886 Fibonacci Retracement priced at $23.05.
Let us analyse price action a little closer to highlight any potential support and resistance areas.
NEO/USD – SHORT TERM – DAILY CHART
https://www.tradingview.com/x/miqetF76/
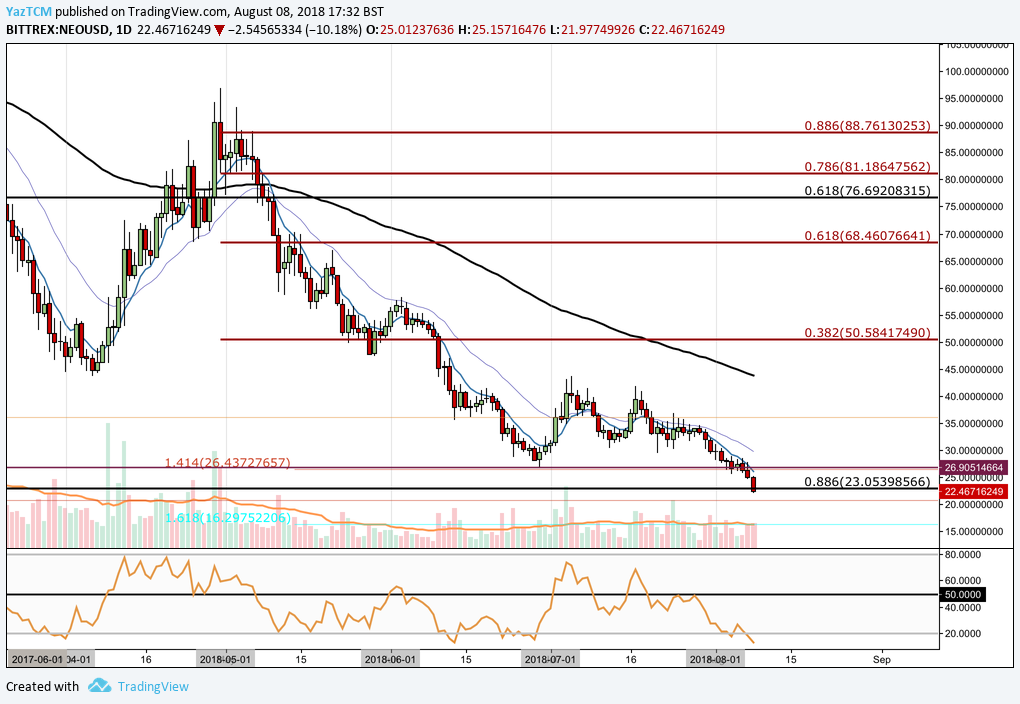
Analysing the market from a shorter perspective, we can see that during June, the market was supported by a short term downside 1.414 Fibonacci Extension priced at $26. Price action has recently dipped below this level to find support at the .886 Fibonacci Retracement priced at $23.05.
If the market continues further lower, we expect immediate support to be located at a long term 1.414 Fibonacci Extension priced at $20.76. If the bears can continue to push the market further below this level, more support is expected at the downside short term 1.618 Fibonacci Extension priced at $16.29.
Alternatively, if the bulls can gather momentum in this area we expect immediate resistance to be located at the 1.414 Fibonacci Extension priced at $26.43. Further significant resistance above this level will be expected around $40 which is July’s price high combined with the psychological round number Schelling point and the 100 day moving average which is also located within the same area.
The RSI is currently trading well below the 50 handle in extreme oversold conditions. This indicates that the bears are completely in control of the market. For a sign that the bears may be beginning to lose steam we will look for the RSI to make its way back toward the 50 handle.
Let us continue to quickly analyse price action relative to Bitcoin over the long term.
NEO/BTC – LONG TERM – DAILY CHART
https://www.tradingview.com/x/7vYBnbfJ/
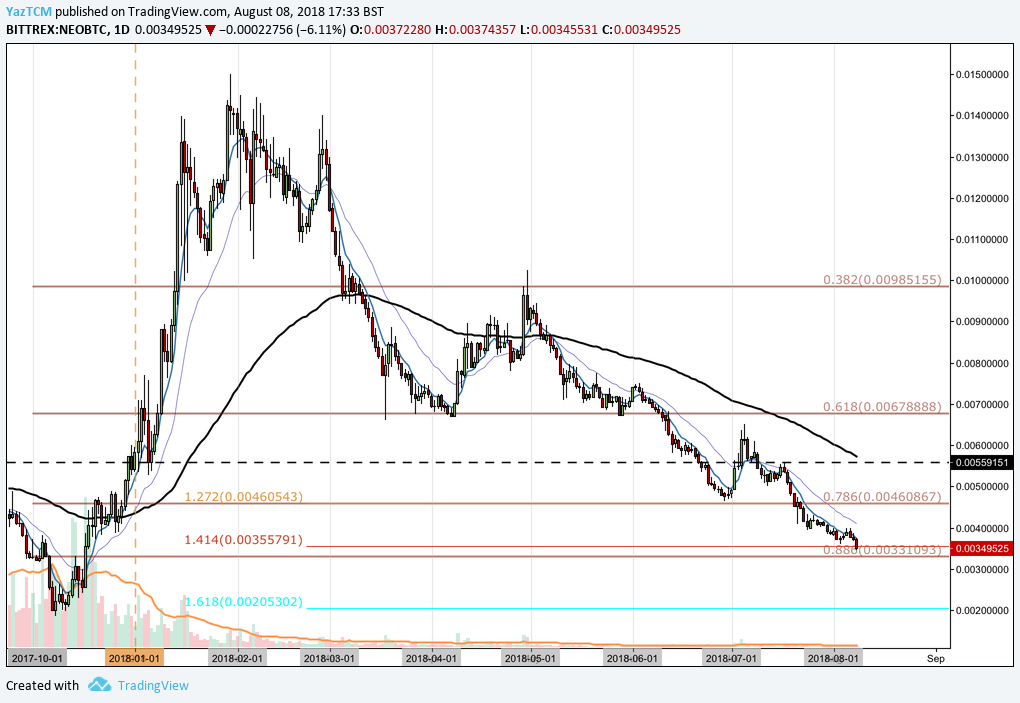
Analysing the market from a long term perspective, relative to Bitcoin, we can see that Neo had experienced an incredible bullish run toward the end of 2017. The bull run started at a low price of 0.002 BTC on the 8th of December 2017 and extended to a high of 0.0150 on the 30th of January 2018. This was a price increase of over 700% from low to high.
We can see that after placing the all time high the market rolled-over, initially finding support at the .618 Fibonacci Retracement priced at 0.0067 BTC during March 2018. Price action continued to fall throughout the trading year until finding support at where it is currently trading at the .886 Fibonacci Retracement priced at 0.0033 BTC. We can see that this area of support is bolstered by a downside 1.414 Fibonacci Extension priced at 0.0035 BTC.
We are expecting the .886 Fibonacci Retracement to hold within this market, but if it does fall below we expect immediate support to be located at 0.03 BTC followed by 0.025 BTC.


, and Stellar (XLM) Price Analysis – Recovery Expected Above Major Support Levels")