

Nano coin has seen a small 0.57% price drop over the past 24 hours of trading. It is currently exchanging hands a t a price of $2.27 after suffering a further 7.39% price drop over the past 7 trading days.
Nano coin is a cryptocurrency founded by Colin LeMahieu in 2015 and was later rebranded from its original name, RaiBlocks, in January 2018.
The Nano coin architecture utilises something different from blockchain technology. Instead of the traditional block after block approach, the Nano team have decided to use wahat is known as a DAG instead of a blockchain. With a DAG as a consensus mechanism all of the transactions are directly linked to one another and are verified by each other.
With this type of platform, the Nano cryptocurrency can offer fee-less, trustless and instant transactions, something which typical blockchain counterparts struggle with achieving as they scale.
Nano is currently ranked in 32nd position in terms of overall market cap across the entire industry. It currently has a total market cap value of $301 million after suffering a 33% loss over the past 30 trading days. The 19 month old cryptocurrency is currently exchanging hands at a value that is 93% lower than its all time high value.
Let us continue to analyse price action for Nano over the medium term and highlight any potential support and resistance levels for this crypto.
Price Analysis
NANO/USD – MEDIUM TERM – DAILY CHART
https://www.tradingview.com/x/3fxvrjjZ/
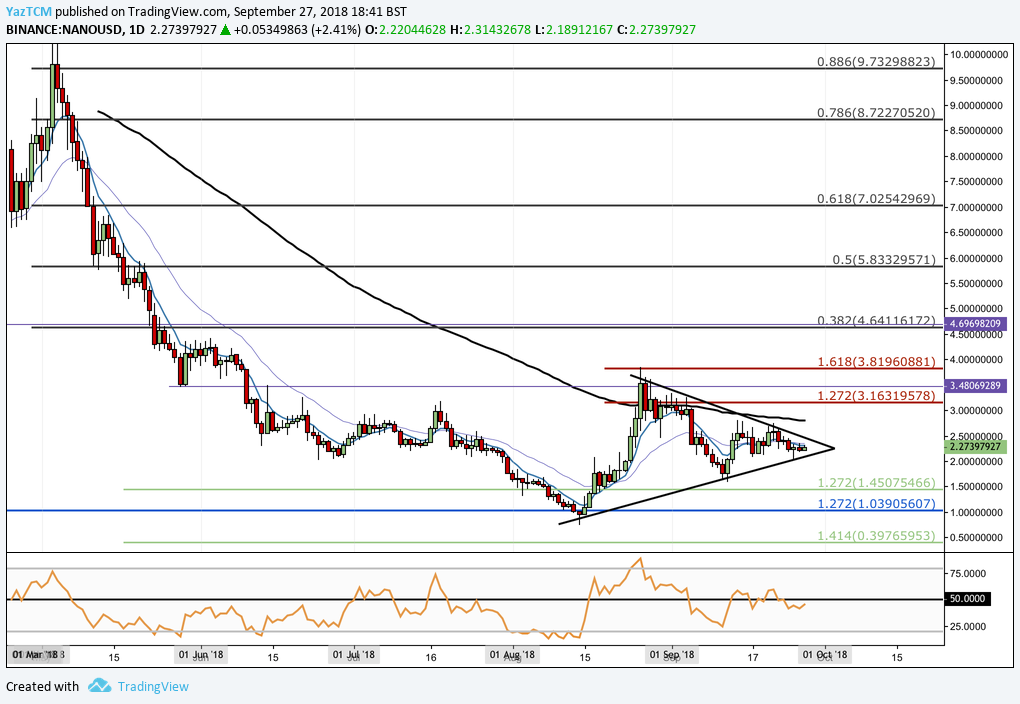
Analysing the market from the medium term above, we can see that Nano had been consistently falling since May 2018. It continued to fall until reaching support at a long term downside 1.272 Fibonacci Extension level (drawn in blue) priced at $1.0390 during August 2018. We can see that as the market had approached this level it reversed and began to rally aggressively.
We can see that as the market began its bullish run during August 2018, price action continued to rally until meeting resistance at a 1.618 Fibonacci Extension level (drawn in red) priced at $3.8196. As the market reached this area of resistance it rolled over and began to decline.
The market has been forming a tight consolidation pattern known as a symmetrical triangle over the past 6 weeks. We can see the triangle characterised by the upper and lower boundary in which the market has now approached the apex within.
Typical, the symmetrical triangle will break out in the direction of the previous trend, which in this case would be bearish. However, there are signs that the bulls may take advantage of this consolidation period and produce a breakout toward the upside.
In the case that price action does break toward the upside, we expect immediate resistance above to be located at the 100 day moving average which is hovering a rebound the $3.00 handle.
This combined with the psychological round number handle at $3.00 will require significant volume for the market to overcome. Resistance above this level can then be expected at the 1.618 Fibonacci Extension level (drawn in red) priced at $3.81.
Alternatively, if the bears push price action below the lower boundary of the symmetrical triangle, we can expect immediate support located below to be at the short term downside 1.272 Fibonacci Extension level (drawn in green) priced at $1.45 followed by the long term downside 1.272 Fibonacci Extension level (drawn in blue) priced at $1.03.
The technical indicators within the market are currently leaning neither towards the bulls nor the bears at this current moment in time. If the RSI can break up above the 50 handle we can expect this market to continue to make higher gains.
, and Stellar (XLM) Price Analysis – Recovery Expected Above Major Support Levels")
 and Stellar (XLM) Weekly Price Performance Overview")
