Monero has seen a small price increase totalling +2.4% over the past 24 hours of trading. The cryptocurrency is currently exchanging hands at a price around $107.79, at the time of writing after seeing a 1.16% price hike over the past 7 rolling trading days.
Monero is the only cryptocurrency in the top 10 (besides Stellar who has seen a +0.5% increase) to see positive price action over the past 24 hours of trading as the rest of the market suffers losses of up to -3%.
Monero was designed to become a completely decentralised cryptocurrency with a particular focus on privacy. They use cryptographic techniques to obscure transaction data making it difficult for a blockchain analyst to forensically examine who owns which transactions.
The Monero network has recently undergone an network upgrade on October 18th 2018 when the developers implemented the cryptographic technique of bulletproofs. Bulletproofs are designed to increase the privacy of individual transactions. It also helps to decrease individual transaction sizes on the blockchain by a significant factor.
Since bulletproofs have been activated on Monero the transaction fees have plummeted from a high above $0.80 to a low below $0.02. This will make a huge impact on scalability as fees tend to rocket when blockchains become clogged up.
Monero is currently ranked in 10th position in terms of overall market cap across the entire industry. It currently holds a total market cap value of $1.78 billion after suffering an 11.57% price decline over the past 30 trading days. The 53 month old currency is currently trading at a value that is 78% lower than its all time high value.
Let us continue to analyse price action for Monero over the short term and update any potential support and resistance zones.
Price Analysis
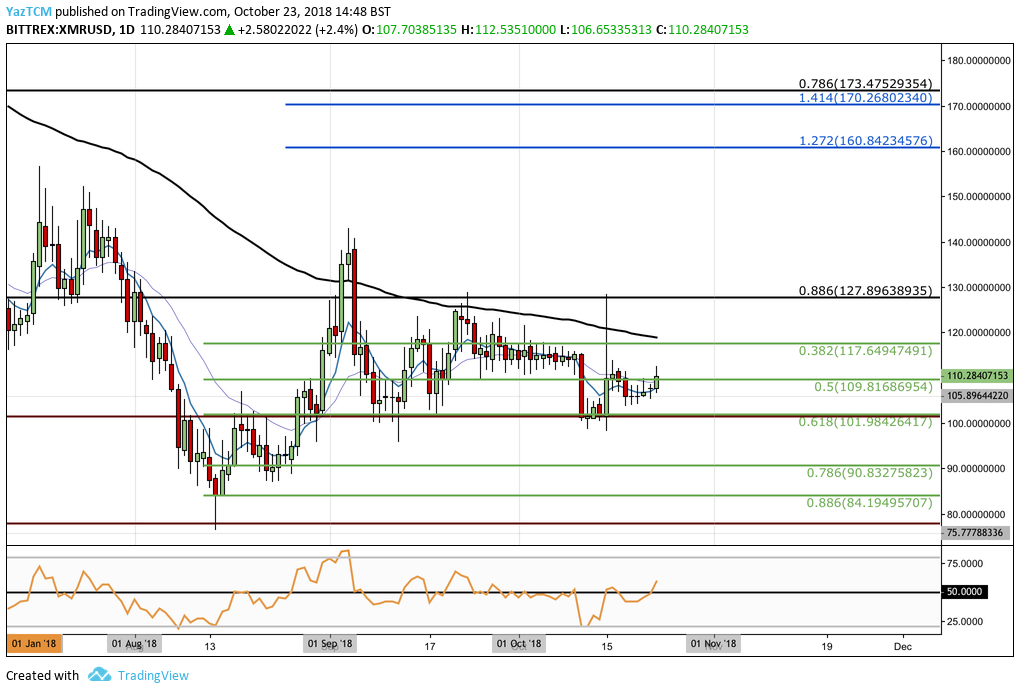
XMR/USD – SHORT TERM – DAILY CHART
https://www.tradingview.com/x/SsG292Tt/

Analysing price action from the short term perspective above, we can see that Monero has been trading sideways since our last analysis. The market had found support at a downside 1.414 Fibonacci Extension level (drawn in maroon) priced at $78.04. As the market approached this area, the bears ceased to push the market lower and the bears stepped in to drive price action higher.
The market then surged from a low of $76.36 on the 14th of August 2018 to a high of $143.09 on the 4th of September before rolling over and reversing. We can see that the market then pulled back to find support at the short term .618 Fibonacci Retracement level (drawn in green) priced at $101.98.
This level of support proved to be significant over the following few weeks as it protected the market from dipping below the $100 handle. Price action has recently rebounded once again from this support level during October and is now trading at resistance provided by the short term .5 Fibonacci Retracement level priced at $109.81.
If the bulls can push the market above the resistance at $110 we can expect further significant resistance above to be located at the short term .382 Fibonacci Retracement level (drawn in green) priced at $117.64. This area of resistance will require significant momentum to overcome due to the 100 day moving average being closely locate in this area.
If the bullish momentum can press on higher above the 100 day moving average, we can expect further higher resistance above to be located at the long term .886 Fibonacci Retracement level (drawn in black) priced at $127.89 followed by the September highs around the $140 handle.
Alternatively, if the bears continue to pressure the market lower we can expect strong support at the short term .618 FIbonacci Retracement level priced at $101. If the bears do manage to penetrate below the $100 handle we can expect immediate support below to be located at the short term .786 and .886 Fibonacci Retracement levels (drawn in green) priced at $90 and $84, respectively.


