
 Price Analysis and Prediction - October 23")
Supply levels: $209, $218, $225
Demand levels: $203, $196, $188
ETH/USD Medium-term Trend: Ranging
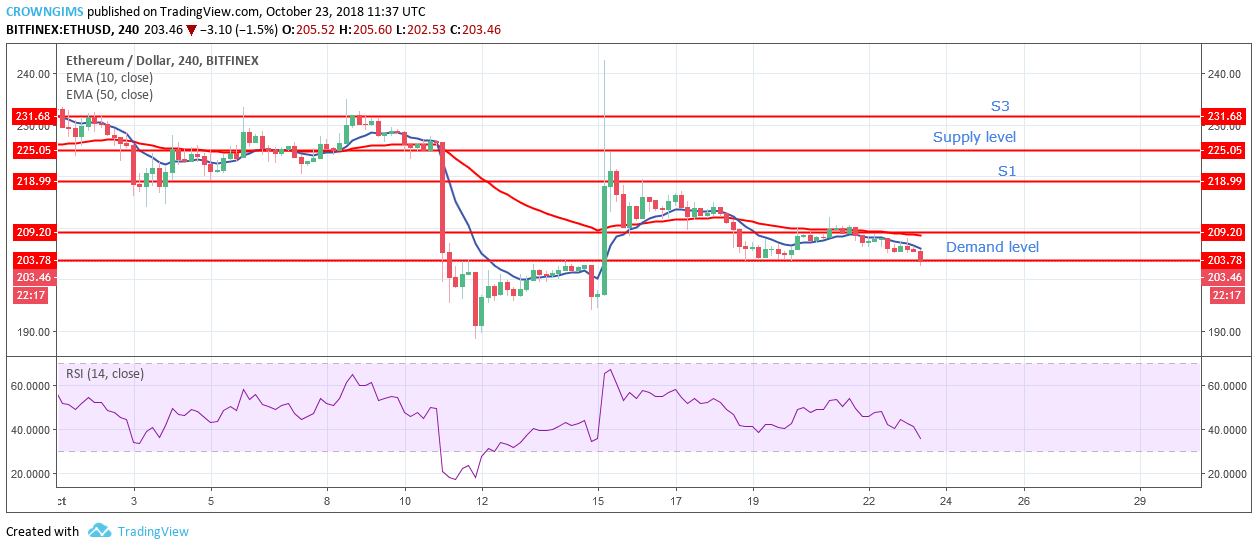
On October 18, ETH broke down the demand level of $209 and found its low at $203. The coin started consolidating within the bound range of supply level of $209 and the demand level of $203.
In case the bulls increase their momentum the coin will rally to the north and may break up the supply level of $209, the ETH price will be exposed to the supply level of $218. At the same time, if the bears increase their pressure and break down the demand level of $203, ETH will find its low at the demand level of $196.
ETH price is below 10-day EMA and 50-day EMA, 10-day EMA has also crossed over 50-day EMA downside which indicates downtrend is ongoing. The RSI 14 is above 30 levels and its signal lines point downward, which indicates a downward movement.
ETH/USD Short-term Trend: Bearish
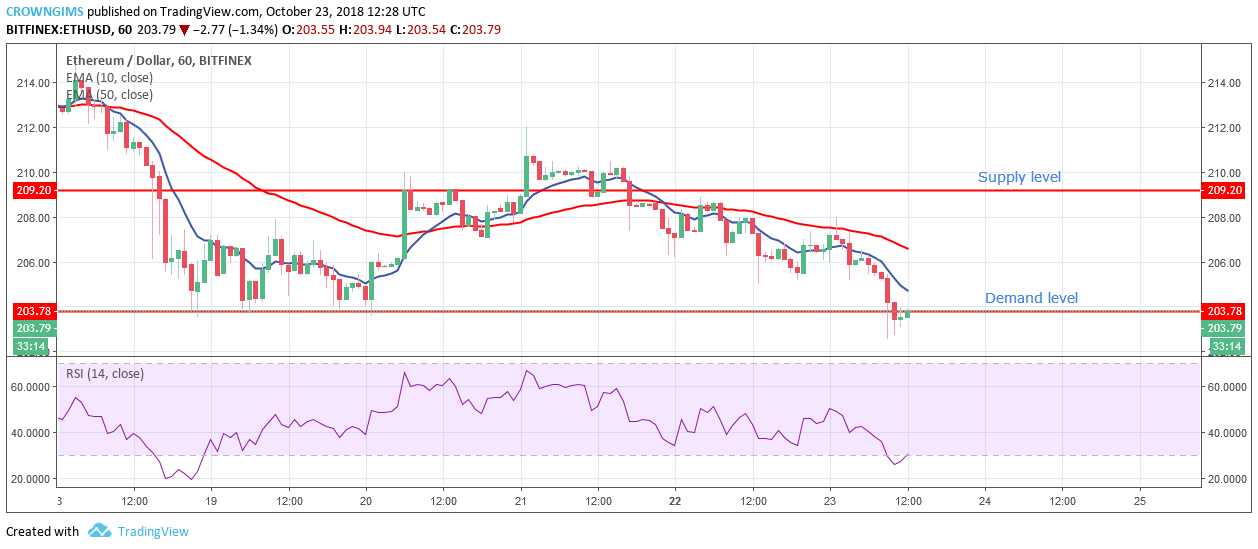
Cryptocurrency is bearish in its 1-Hour chart. ETH made a bearish run to the demand level of $203 with the formation of a bearish engulfing candle. It has broken the demand level of $203 exposed the demand level of $196. The bears are in control of the market today.
The ETH Price is below the 10-day EMA and the 50-day EMA above the 10-day EMA, the two EMAs are well separated which connotes the downtrend movement is ongoing. Meanwhile, RSI 14 is below 10 levels with its signal lines pointing upward which indicates the possibility of uptrend movement which may serve as a price retracement.


