
, Cardano (ADA) and Tron (TRX) Price Analysis And Forecast")
Bitcoin Cash (BCH/USD)
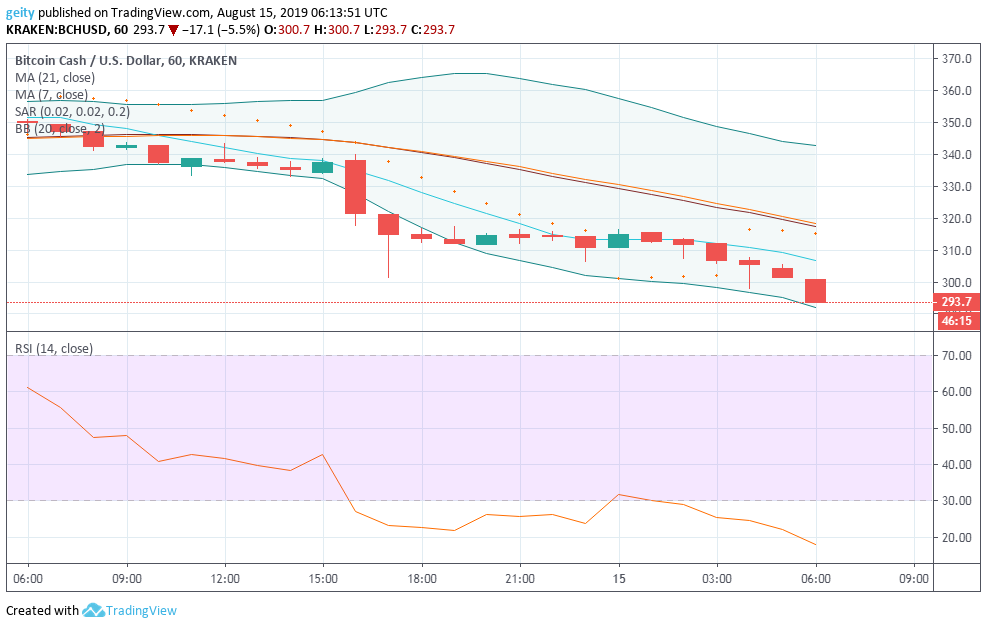
BCH being among the top-performing cryptocurrencies has today continued trading on bearish market momentum. The underperformed crypto has dipped by 16.04%, having escalated from where it started the sell-off at $349.8 to a current price of $293.7.
The parabolic indicator is at the moment above the candles that give investors a sell signal. The relative strength index indicator has dropped from the overbought territory to the oversold territory that signaled an increase in bearish pressure.
Forecast
High possibility of more bear market is to be expected since the 21 day MA is still above the 7 day MA and the Bollinger band has currently expand which shows that the market is loud thus investors should expect a further decline in the price momentum. New targets should be set at $280.0.
Monero (XMR/USD)
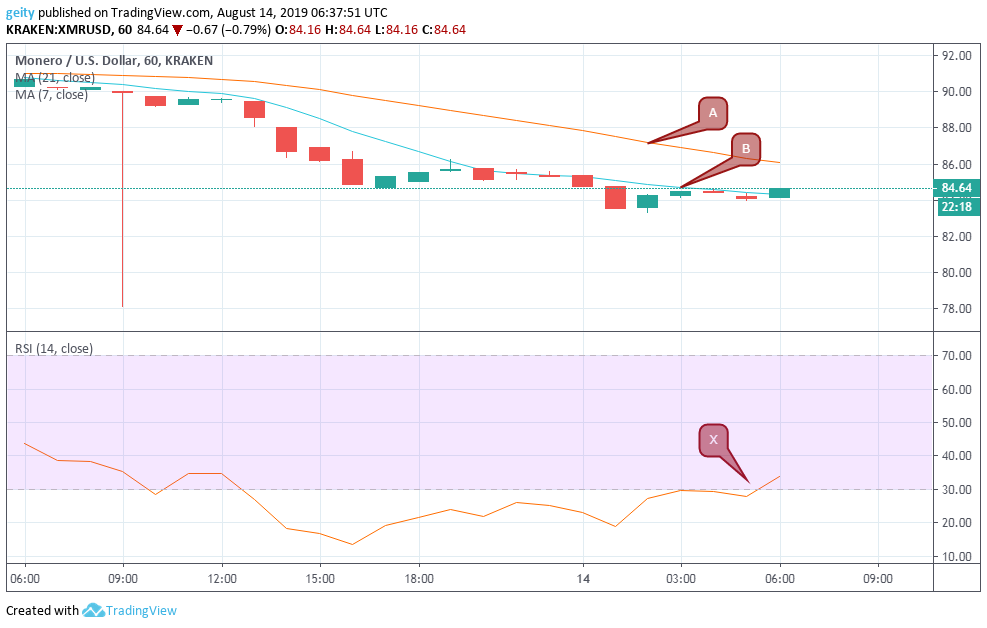
XMR/USD has also recorded a bearish outlook, on an hourly chart that showed a lack of buyers in the market. The downward move has pushed the pair’s price down to $74.87 from where it began trading at $84.21, this totals up to 11.09% decrease over the last 24hrs.

At the moment, both the moving averages are heading south, and the RSI indicator has dropped into the oversold zone which is a negative sign. The parabolic SAR indicator also gives a sell sign since it is at the press time seen above the candles.
Despite the dip, an upward rally is likely to be seen before the end of August. This is because the Cake Wallet is going to sponsor monero meetup before the end of August. This may attract more investors and might positively boost the price of XMR.
Forecast
At the moment, all the technical indicators are pointing at the further bearish rally. With the expanded Bollinger band, a steep decline may be seen later on. Additionally, a short-term period of consolidation is likely to be encountered below $72.00 before a breakout. New targets should be set at $68.00.
Binance Coin (BNB/USD)
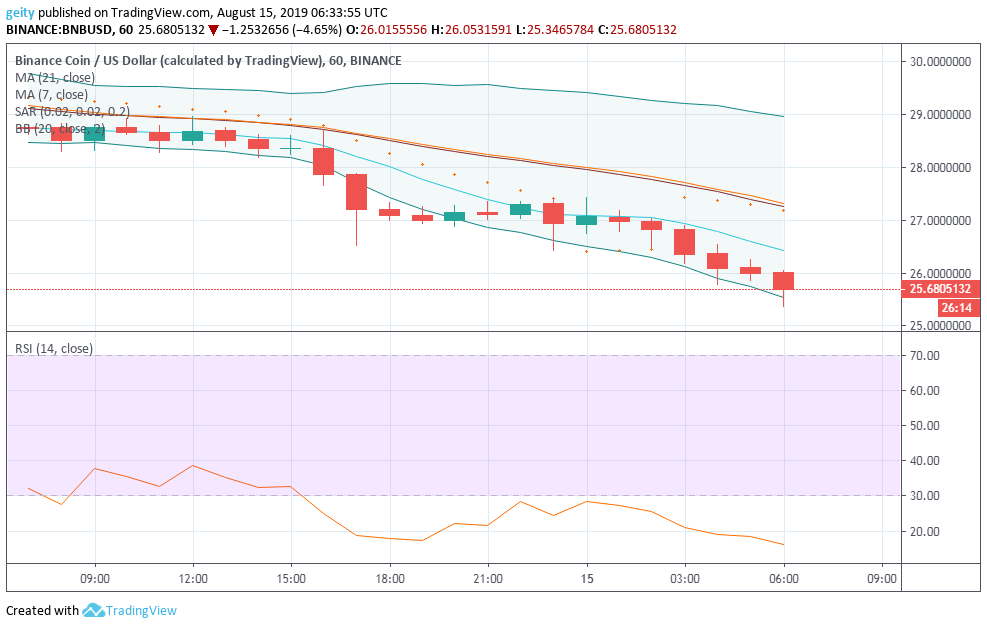
BNB/USD pair has dipped below the moving averages. The downward rally has led to a price dip of 10.7% over the intraday. The bulls seemed to have failed to correct gains, which, have resulted in a bearish sign. This has led to a breakout below the critical support level near $26.8236, with major resistance level found near $29.0191. Apparently, the market showed no attempt to breach or test the resistance level that confirmed the downward move.
The parabolic SAR indicator is currently above the candles that recommend traders to go short. The RSI indicator was seen trading on the oversold territory that indicated an increase in sell-offs. Additionally, the RSI indicator is currently flattish that foresee an incoming period of consolidation below $24.0000.
Forecast
A high possibility of a more bearish outlook is likely. This is because both the moving averages and the parabolic SAR are tending south. The Bollinger band has also expanded, this shows loud market momentum.
 Emerges as Top Choice for Investors, Toppling BNB and Ethereum")

