
 Technical Analysis #002 - Ethereum Starts July on a Strong Note")
Ethereum has started the month of July on a solid foundation as price action rises by 3.9% over the past 24 hours alone. Ethereum is currently trading hands at a price of $467, at the time of writing.
This price rebound comes after 2 months of declining prices for Ethereum. The price value is down by a total of 24.47% over the last 30 trading days alone.
Ethereum was created by Vitalik Buterin and was announced in January 2014, making it one of the oldest cryptocurrencies around behind Bitcoin. It was designed as a decentralised “computer” which would allow for dapps to run smart contracts upon.
The adoption of Ethereum has been enormous with many projects using the Ethereum blockchain. However, in recent months the scalability of Ethereum has come to question as the dapp CryptoKitties created a backlog of transactions upon the Ethereum network.
Since the episode with CryptoKitties, Vitalik has come forward and addressed the issue surround scalability with the new technology known as “Sharding” and “Plasma” which would effectively allow Ethereum to process up to thousands of transactions per second.
Ethereum is currently sitting at rank 2 in terms of overall market cap, only second to Bitcoin.
Let us analyse Ethereum’s price over the short term.
Price Analysis
ETH/USD – SHORT TERM – DAILY CHART
https://www.tradingview.com/x/ohH1p2L8/
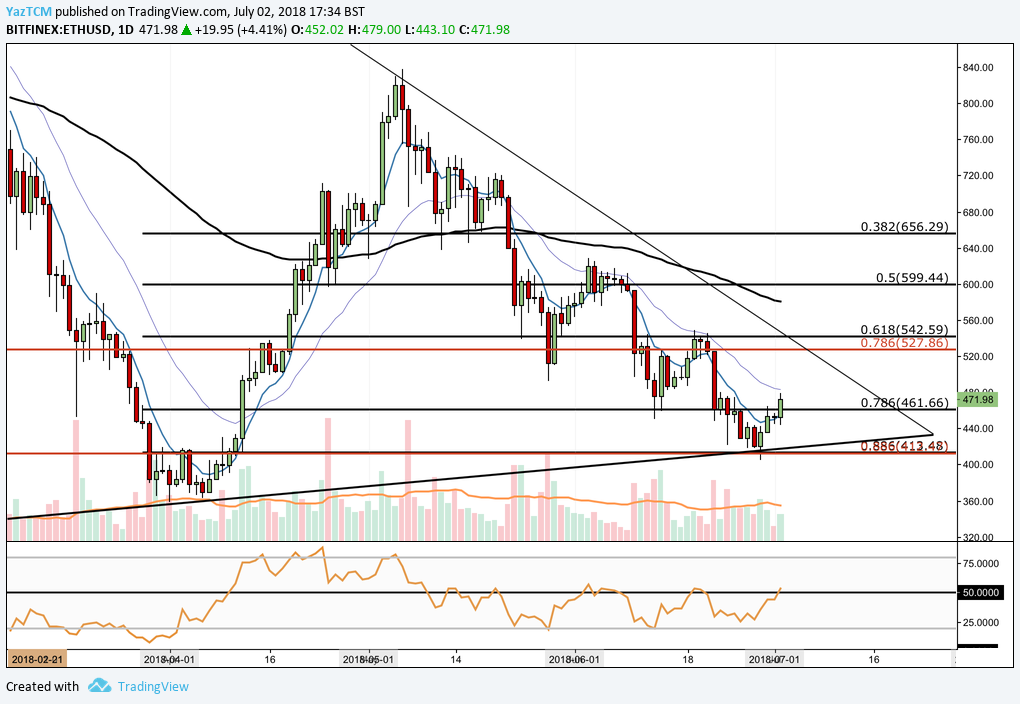 In our last analysis, we had outlined that Ethereum was trading within the range of a long term symmetrical triangle. The market is still trading within the confines of this triangle and has recently tested the lower boundary where a rebound was experienced.
We can see that price action had experienced an incredible bullish run rising from a low of $363 on the 6th of April to a high of $838 on the 6th of May. This was a price increase of over 130% from low to high.
SInce placing this high in May, we can see that price action has depreciated and fallen toward the .886 Fibonacci Retracement priced at $413. This is a Fibonacci Retracement taken from the entire bull run outlined above.
Price action found support at the .886 Fibonacci Retracement and rebounded, pushing the market back above the .786 Fibonacci Retracement to where it is currently trading around $471.
The support found at the .886 Fibonacci Retracement is also reinforced by a long term .886 Fibonacci Retracement, also located within the same region. If the bearish pressure re-enters the market, significant support should be once again found at the .886 Fibonacci Retracement.
Alternatively, if the bullish momentum recently experienced continues, the market will be testing near term resistance located at the .618 Fibonacci Retracement priced at $542, very soon. Resistance beyond $542 comes in at June’s monthly high priced at $628.
The technical indicators are beginning to show promise toward the bulls at this moment in time. The RSI has battled toward the 50 handle, if it can break above 50, this would indicate the increased bullish momentum entering the market.
SImilarly, the 7 day EMA and the 21 day EMA EMA have stopped trading toward the downside. If the 7 day EMA can approach the 21 day EMA and cross above, this would indicate that the bearish momentum has left the market and the bulls are beginning to take charge.
Let us quickly analyse how Ethereum has been trading relative to Bitcoin over the short term.
ETH/BTC – SHORT TERM – DAILY CHART
https://www.tradingview.com/x/hRWhjeIM/
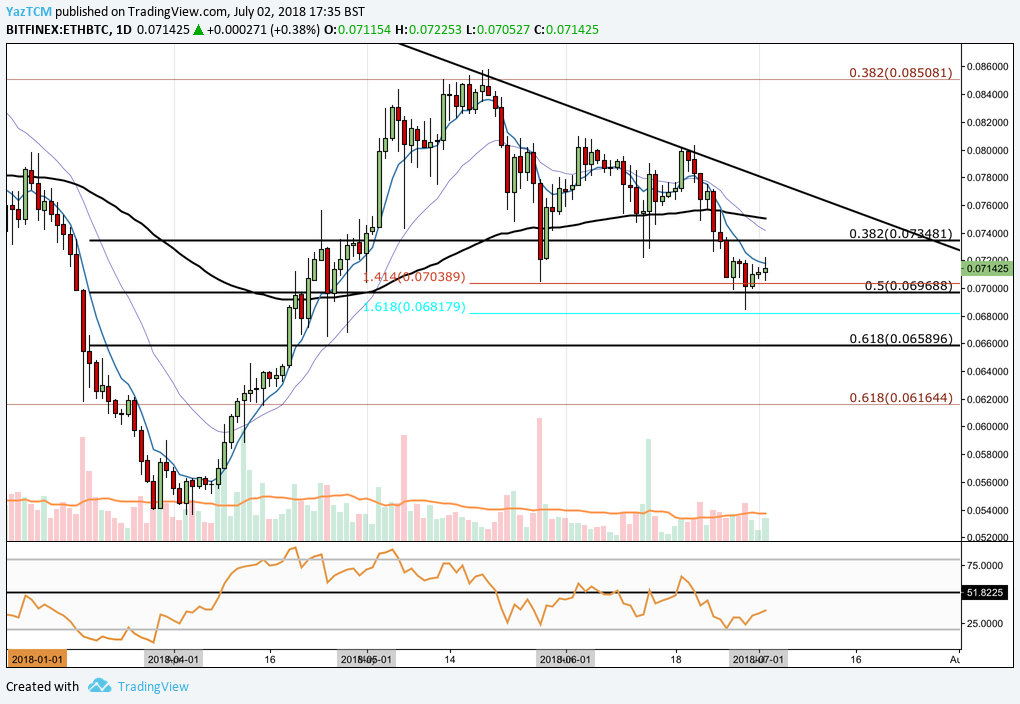
Analysing the market from the short term perspective above, we can see that ETH had experienced a major bullish run in April and May as price rose from a low of 0.053618 to a high of 0.083851, a price increase of close to 60%.
We can see since placing this high, price action has depreciated until the market recently found support at the .5 Fibonacci Retracement located at 0.069688. This is a Fibonacci Retracement taken from the entire bullish run described above.
If the recent bullish momentum can break the market above the .382 Fibonacci Retracement priced at 0.073481 then this would allow the bulls to retest June’s high priced at 0.081.
Alternatively, if the market manages to fall below the .5 Fibonacci Retracement, then the nearest form of support is located at the .618 Fibonacci Retracement located 0.06589


