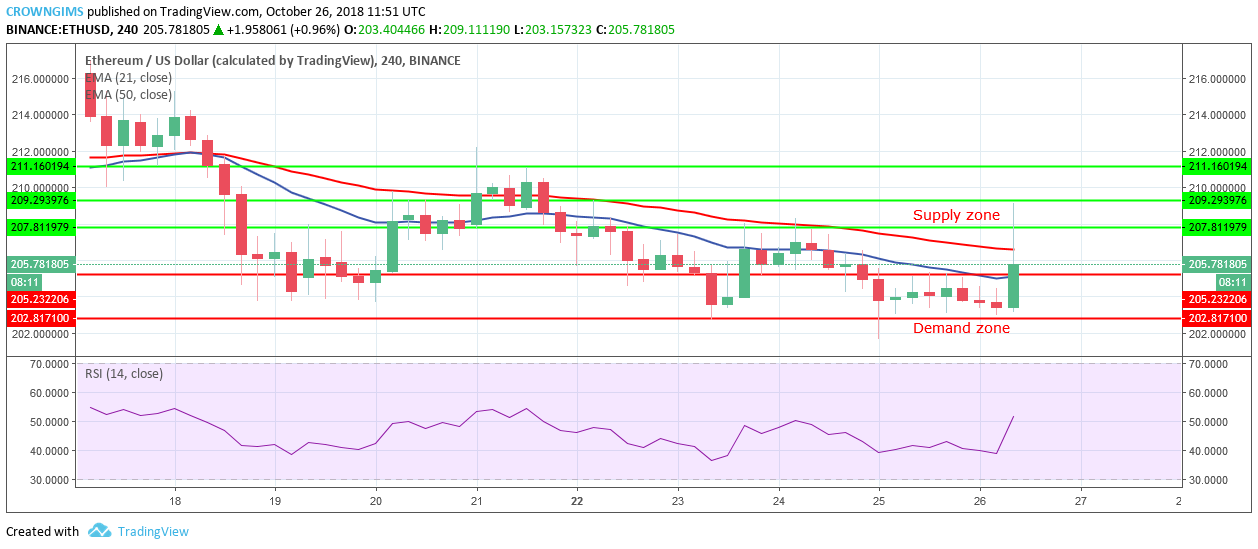
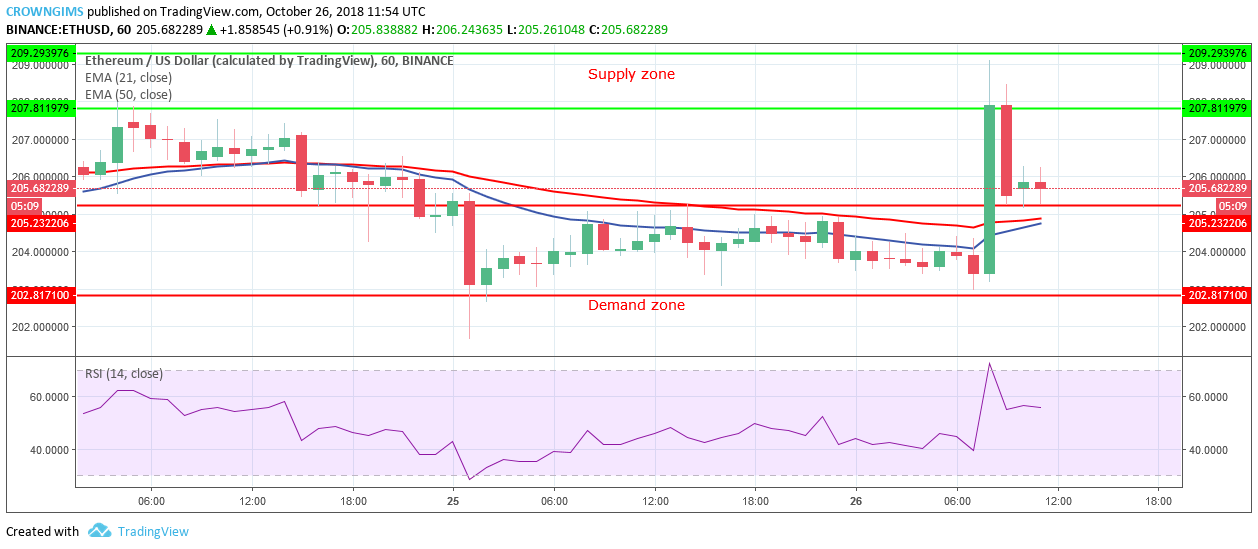
Supply zones: $207, $209, $211
Demand zones: $205, $202, $198
ETH/USD Medium-term Trend: Bearish

ETH is in its bearish trend on medium-term outlook. On October 21, the cryptocurrency started falling shortly after the coin rally to the north and broke up the supply zones of $207, $209, $211. The bears moved into the market with their high pressure and pushed the coin to the demand zone of $202.
Early yesterday, the coin was bearish and later consolidated till early trading hour today. As at now, the bulls have moved into the market and pushed ADA price from the demand zone of $202, broke the supply zones of $205, $207and $209 before the bears return ADA price to demand zone of $205.
In case the bears increase their momentum and the coin breaks the demand zone of $205, then it may find its low at the demand zone of $198. If the price falls to the demand zone of $190, traders should look out for buy setups to initiate long trades.
ETH is between the 21-day EMA and 50-day EMA with the two EMAs separated from each other, which indicates that the price is falling. Nevertheless, the Stochastic Oscillator period 14 is above 50 levels, which indicates buy signal.
ETH/USD Short-term Trend: Bearish

ETH/USD is bearish in its short-term outlook. ETH has been bearish till today when the bulls pushed the price to the north suddenly, broke the supply zones 0f $205, $207 and reached $209 but could not break up the supply zone of $209.
The bears have pushed the price back to demand zone of $205 this is confirmed by the formation of a long bearish candle. ETH is above 50-day EMA and 21-day EMA is under 50-day EMA. The two EMAs are coming closer to each other which indicate that the market may consolidate.
Nevertheless, The Stochastic Oscillator period 14 is below 60 levels with signal lines parallel without direction which connotes consolidation.


