

The worrying times continue for Ethereum as the cryptocurrency drops a further 1.47% over the past 24 hours of trading. Ethereum is currently exchanging hands at a price of $180.44 after the cryptocurrency sees a precipitous price decline totalling 25.88% over the past trading week.
Ethereum is a total of 87% down from it’s all time high price causing many investors concern as to when the price decline may show signs of slowing down. Vitalik Buterin, this week added fuel to the fire as many misinterpreted his comments regarding the growth of cryptocurrency in a negative way.
Buterin had stated that there was no longer room within the cryptocurrency industry to see another 1000x price increase. However, he did not say that there is no space for growth.
Ethereum is currently ranked at 2nd position in terms of overall market cap across the entire industry. It has a total market cap value of $18.40 billion after the 67 month old coin sees a 64% price drop over the past 90 trading days.
Let us continue to analyse price action for Ethereum over the short term and update our expected support and resistance areas.
Price Analysis
ETH/USD – SHORT TERM – DAILY CHART
https://www.tradingview.com/x/ZJ03fWKY/
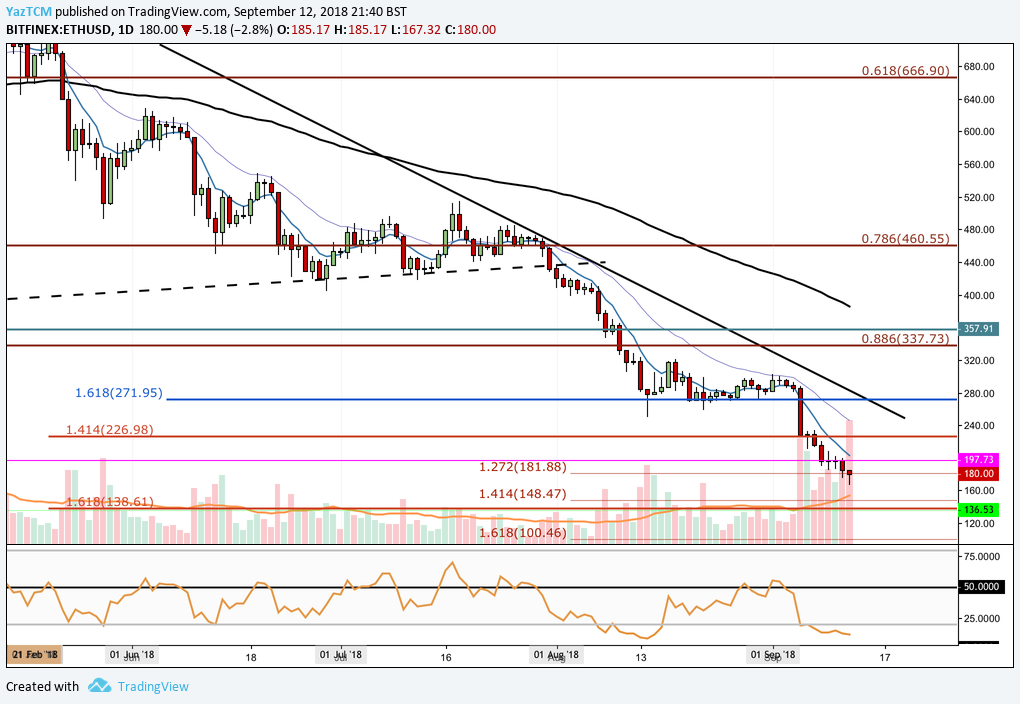
Ethereum has continued to drop since our last analysis piece, falling below our expected support level around the $226 handle. In fact, Ethereum continued to fall far below $200 as the cryptocurrency currently trades at lows not seen for 14 months since July 2017.
At the time of our last analysis, price action was trading at the downside 1.618 Fibonacci Extension level (drawn in blue) priced at $271.95. We can see that this level of support had held strong for a period of 2-3 weeks before price action plummeted below early in September 2018. Price action continued to fall below our expected support at the downside 1.414 Fibonacci Extension level priced at $226.
We can see that the market has gained some relative stability at a short term downside 1.272 Fibonacci Extension level (drawn in dark red) priced at $181.88.
If the bearish pressure continues, which we can assume will happen, the nearest level of support is expected at the short term downside 1.414 Fibonacci Extension level priced at $148.47. Further support then expected below this level will be located at the longer termed downside 1.618 Fibonacci Extension level priced at $131 followed by the shorter termed downside 1.618 Fibonacci Extension level priced at $100.46.
Alternatively, if the market can gather some form of bullish momentum at this area we expect immediate significant resistance to be located at the $200 handle followed by the previous 1.414 Fibonacci Extension level priced at $226.
If the bullish pressure can continue to push price action even higher, we can expect further resistance to be located at the previous 1.618 Fibonacci Extension level (drawn in blue) priced at $271. This price area has provided significant support in the past so it can be expected to provide a similar of resistance moving forward (old support now turned resistance).
The technical indicators within the market are currently heavily favouring the bears at this moment in time. The RSI is trading well below the 50 handle at oversold conditions. The RSI has not been this low since mid-August and does not have much room to continue lower.
However, do not be fooled, the RSI can stay in oversold conditions for a long period of time. If we would like to see the market regain some its losses we would need to see the RSI rise up out of oversold conditions and break above the 50 handle. For a sign that the bearish momentum is fading we will be looking for the RSI to start to leave the oversold conditions it is currently trading within.
 Price Up 62% From Bottom, Can The Bulls See More Gains?")

