

Dash has seen a small 0.18% price increase over the past 24 hours of trading. The cryptocurrency is currently exchanging hands at a price of $190.04 after seeing a 34% price increase over the past 30 days of trading.
Dash continues to hold the number 11 ranking in terms of overall market cap across the entire industry. It currently holds a total market cap value of $195 million after the 55 month old coin sees a 20% price drop over the past 90 trading days.
Let us continue to analyse price action for Dash and update our expected support and resistance areas.
Price Analysis
DASH/USD – SHORT TERM – DAILY CHART
https://www.tradingview.com/x/yzlKiofn/
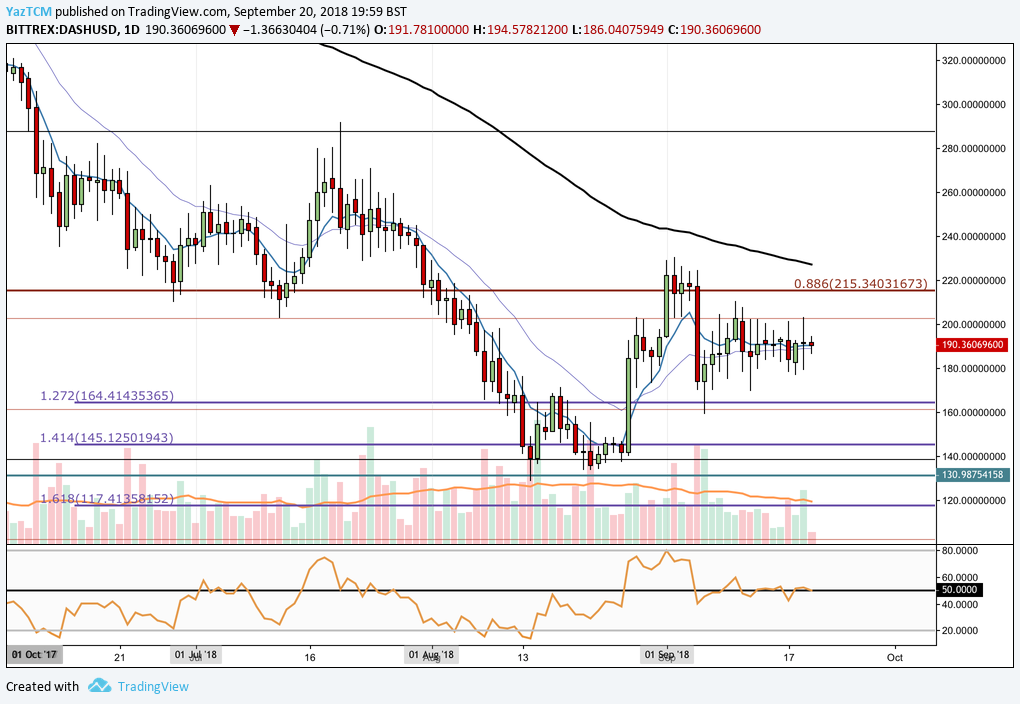
Analysing price action from the short term perspective above, we can see that our expected support at the $130 price level held strong as the market rebounded. Specifically, we can see that price action found support at our long term downside 1.618 Fibonacci Extension level priced at $138. Price action rebounded aggressively from this price level.
We can see that the market continued to ascend after the rebound until finding resistance at the long term .886 Fibonacci Retracement level priced at $215, recently in early September 2018. Since meeting the resistance the market has been trading sideways between the $215 handle an the $164 handle as traders decide on which way the market should head toward next.
If the bearish pressure reenters the marke we expect initial support to be located immediately at the short term downside 1.272 Fibonacci Extension level (drawn in purple) priced at $164. Support then expected below this can be expected at the downside 1.414 FIbonacci Extension level (drawn in purple) priced at $145. If the bearish pressure continues further support can be found at $138 and then $130 which is the July 2017 low day closing price.
Alternatively, if the bulls continue to push the market higher, we expect immediate resistance to be located at the .886 Fibonacci Retracement level priced at $215. If the bulls can persist higher, then further significant resistance can be located at the 100 day moving average which is currently hovering around the $225 handle.
The technical indicators within the market are currently producing natural readings at this moment in time. The RSI continues to trade along the 50 handle indicating that neither the bulls or the bears are in control of the momentum.
Let us continue to analyse price action for Dash over the short term perspective.
DASH/USD – SHORT TERM – 4HR CHART
https://www.tradingview.com/x/YtPs5Os1/
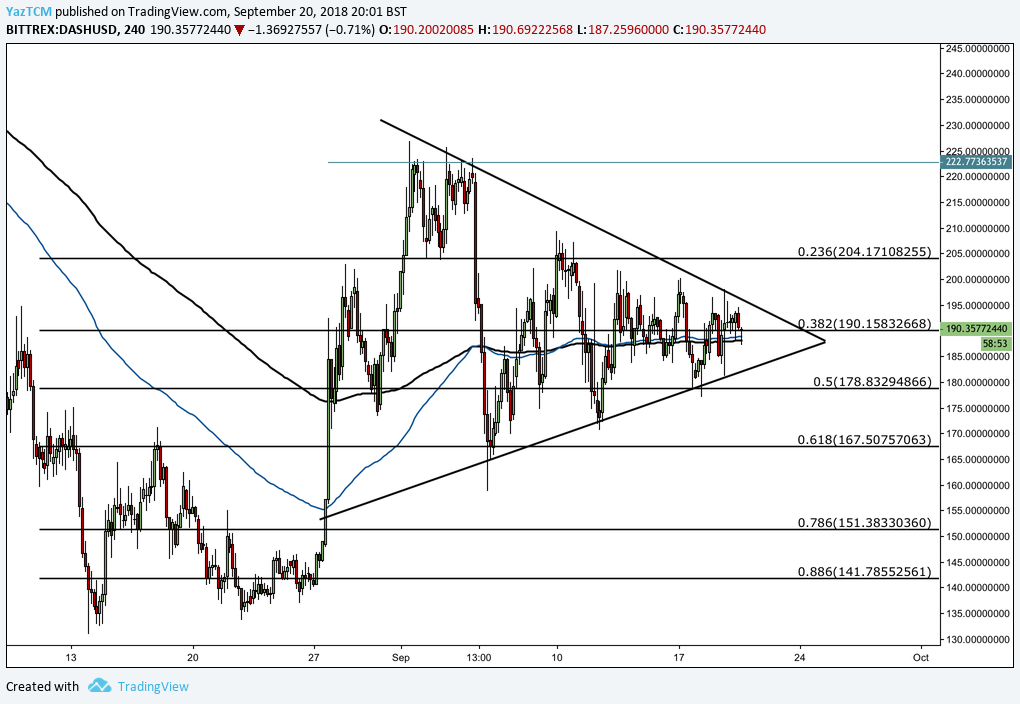
ANalysing the market from the short term perspective above, we can see that price action had experienced a bullish run as the market started from a low of $130 on the 14th of August 2018 and extended to a high of $226 on the 1st of September.
We can see that after placing the high, the market rolled over and fell. It initially found support at the short term .618 Fibonacci Retracement level priced at $167. Price action has since rebounded and consolidated in a tight wedge formation.
We can see the symmetrical triangle/wedge clearly distinguished by the upper and lower boundary.
If the bullish pressure continues, we expect immediate resistance to be located at the upper boundary of the triangle. If the bulls can continue higher, then further resistance can be located at the .236 Fibonacci Retracement level priced at $204 followed by the $222 handle.
Alternatively, any negative pressure is expected to be absorbed by the lower boundary of the triangle. IF the bears can continue lower we expect the .618 Fibonacci Retracement level priced at $167 to provide further support.


