

ADA/USD Price Medium-term Trend: Bullish
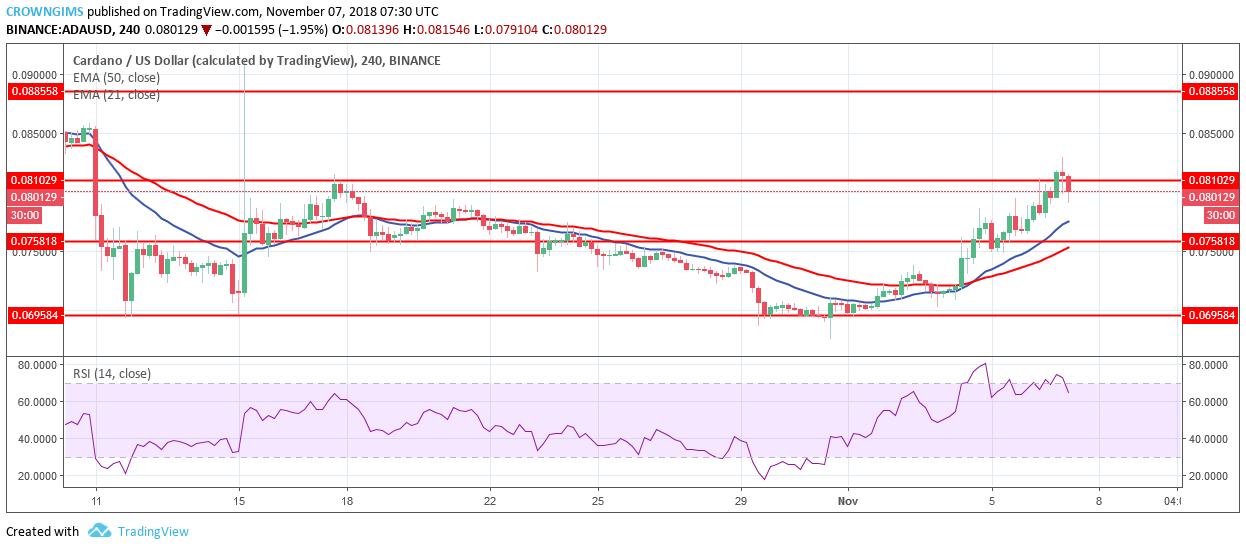
Supply Zones: $0.081, $0.088, $0.096
Demand Zones: $0.075, $0.069, $0.062
ADA resumes its bullish trend movement on the 4-Hour chart. ADA has been on downtrend movement since October 17th after the formation of doji candle at the supply zone of $0.081 and the bears dominated the ADA market. The coin found its low at the demand zone of $0.069.
The bullish pin bar formed at the demand zone of $0.069 trigger the bulls’ pressure that led to the ADA price increment. The bulls pushed ADA price up and broke up the former resistance zones of $0.075 and $0.081. The bulls are presently in control of the market.
As a confirmation of the uptrend movement; 21-day EMA has crossed the 50-day EMA upside. ADA price is trading above the 21-day EMA and the 50-day EMA which indicate that the bullish trend is ongoing. What guarantees the continuation of the uptrend movement is the bulls’ pressure.
If the bears increase their pressure, ADA price will fall and it may find its low at the demand zone of $0.075. Should the bulls defend demand zone of $0.075 there will be a continuation of uptrend movement in which the next target may be supplied zone of $0.088. Nevertheless, the RSI period 14 is at the 70 levels with its signal line point to the south which connotes sell signal.

ADA/USD Short-term Trend: Bullish
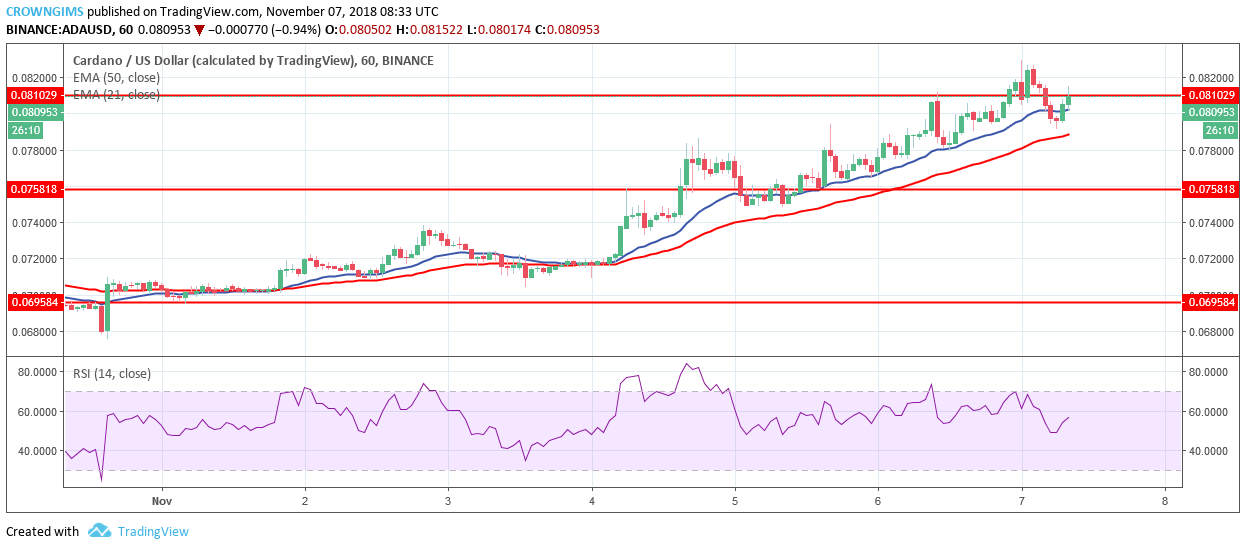
The cryptocurrency is bullish in its short-term outlook. The formation of a bullish pin bar on the two EMAs led to the beginning of uptrend on 1-Hour chart. ADA price is increasing gradually and steady through the pressure of the bulls. Pullback or retest of the broken zone has been done.
The coin is above the 21-day EMA and 50-day EMA which indicates uptrend is ongoing. The RSI period 14 is below 60 levels with the signal line pointing upwards indicating a buy signal.
, and Stellar (XLM) Price Analysis – Recovery Expected Above Major Support Levels")
 and Stellar (XLM) Weekly Price Performance Overview")
