XLM/USD Medium-term Trend: Bullish
Supply levels: $0.26, $0.27, $0.29
Demand level: $0.25, $0.24, $0.23
Stellar continues its bullish trend on the 4-Hour chart. The cryptocurrency started making ‘Higher Lows’ (HL), “Higher Highs” (HH) on the 4-Hour chart since November 1st after the formation of bullish pin bar on the demand level of $0.22.
The bulls have successfully pushed the XLM price to break upside the former supply levels of $0.24, $0.25 and $0.26. Further increase in price was rejected by the bears which resulted in forming a bearish engulfing bar that pushed the coin to break the demand level of $0.25.
XLM price is currently above both 21-day EMA and the 50-day EMA, the coin and the two EMAs are the distance to each other which connotes that the pressure of the bulls is high and the uptrend is ongoing. However, the Stochastic Oscillator period 14 is above 60 levels with signal lines pointing to the south which indicate sell signal which may act as a pullback or retest to the broken level before the coin continues its uptrend movement.
XLM/USD Price short-term Trend: Bullish

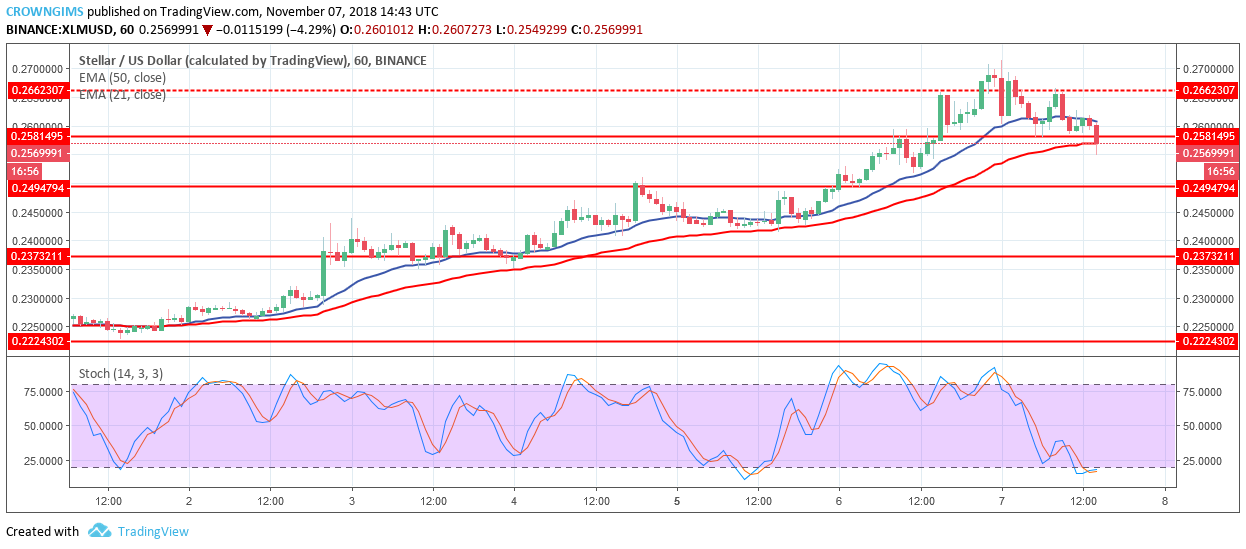
On the 1-Hour chart, the coin is bullish. The bears lose the pressure and the bulls have been in control of the XLM market for more than two days after it broke out of the consolidation phase.
The price rally to the north today and broke upside the supply level of $0.26. The bears rejected the price increase by the formation of the doji candle followed by the strong bearish candles that broke the demand level of $0.25 downside. Further increase in bears’ pressure will make the coin find its low at $0.24 price level.
The XLM price is between 50-day EMA while 21-day EMA, with 21-day EMA above the 50-day EMA which connotes sell signal, though may serve as price retracement. However, Stochastic Oscillator period 14 is at the oversold region (below 20 levels), which indicates that bulls will soon take over the market.


