Resistance levels: $6,960, $7,363, $8,075,
Support levels: $6,678, $6,354, $4,800
BTC/USD Medium-term Trend: Ranging

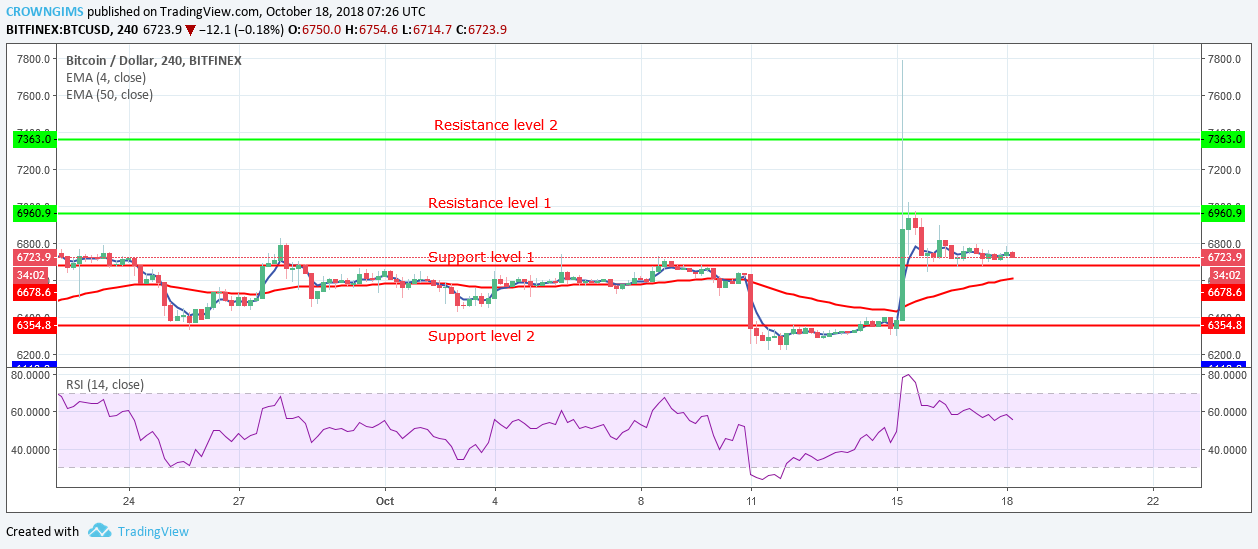
BTC/USD is ranging in its medium-term outlook. The coin experienced a sporadic increase on October 15, when the bulls came into the market with high momentum and the pair broke the resistance levels of $6,960, $7,363 and headed up to $8,075 before the price hike was rejected by the bears.
The sellers also wave into the market and pushed the pair back below resistance level of $6,960; this can be clearly seen by the formation of an upper long-tailed candle, followed by bearish candles and the price was landed on the support level of $6,678 and the pair started consolidating. The bears have lost the pressure; they could not push the coin down below the support level. Also, the bulls have not enough momentum to increase the price.
The bears will have to increase their pressure and break down the support levels of $6,678 before the coin can find its low at $6,354. The same way the bulls require higher momentum to push the pair above this level.
In case the bulls defend the support level of $6,678, the price will bounce back and it will resume its uptrend movement, this will serve as another opportunity for the bulls to take over the control of the market. However, the RSI period 14 is below 60 levels, the signal line point to the south, which indicates a sell signal.
BTCUSD Short-term Trend: Ranging

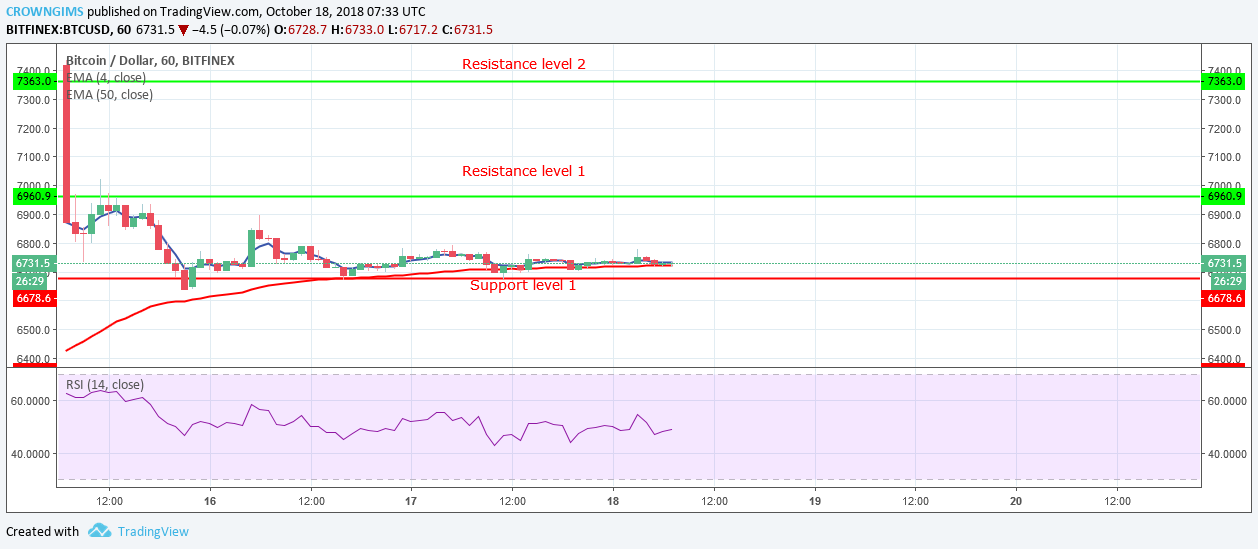
The ranging movement of BTC on the 1-hour chart started on October 15, shortly after the price fall from the sudden hike that took the market to the upper resistance level of $8,075. The bears rejected the price at the level and brought it to the low support level of $6,678.
As at the moment, the price is on the 10-day EMA and 50-day EMA. Meanwhile, the two EMAs are interlocked to each other indicate consolidation is ongoing. Relative Strength Index period 14 is at level 50 without showing any direction, indicating the ongoing consolidation period.


