

Resistance levels: $6,759, $7,363, $8,075,
Support levels: $6,118, $5,858, $4,800
BTC/USD Medium-term Trend: Bearish
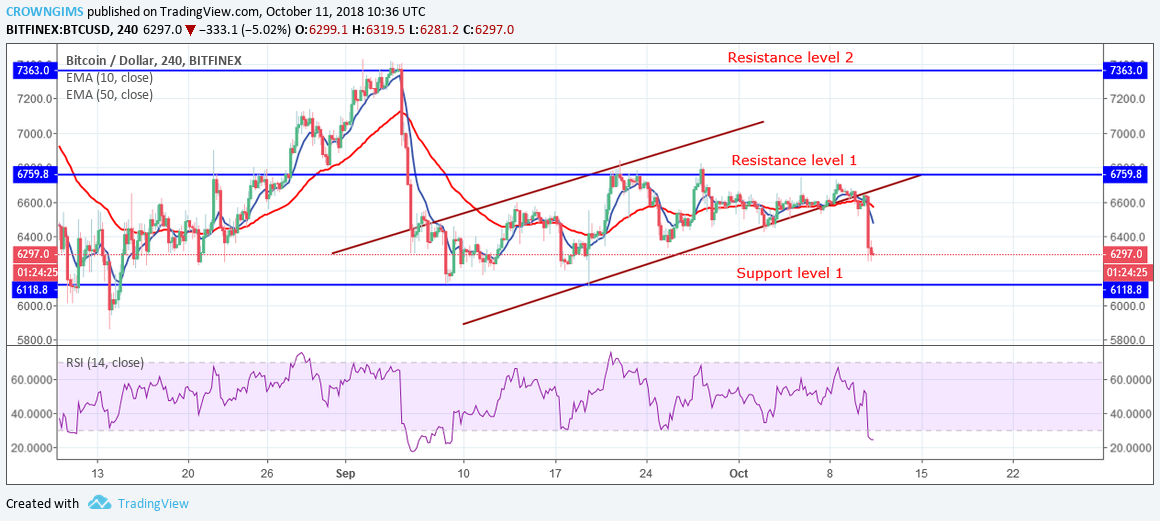
The cryptocurrency is bearish in its medium-term. Before the bearish trend, which took place between yesterday and today the price of Bitcoin had been range bound between the resistance levels of $6,759 and support level of $6,118 in the last 30 days. BTCUSD pair has formed a “pennant” pattern within the range bound.
It has been trading and ranging within the upper and lower trend lines of the pattern. The pattern exists within the range bound of resistance level of $6759 and support level of $6118. It was at this range bound zone that the price pulled down to the lower level. Today, the cryptocurrency has broken the lower trend line of the pattern.
As the price broke this trend line, there are indications that it will find its low at the support level of $6,118. In case the bears defend this zone and the price bounces back, traders should initiate long trades and stop-loss orders below the $6,118 price level. You can exit your long trades at the resistance of $6,759 or when the price reverses.
On the other hand, if the lower level of $6,118 price level does not hold, the BTC price will attempt to reach the lower support level of $5858. However, the RSI period 14 is below 25 levels the signal line point to the north, indicates a buy signal. The price of Bitcoin is below the 10-day EMA and 50-day EMA which indicates that the price is falling.
BTCUSD Short-term Trend: Bearish
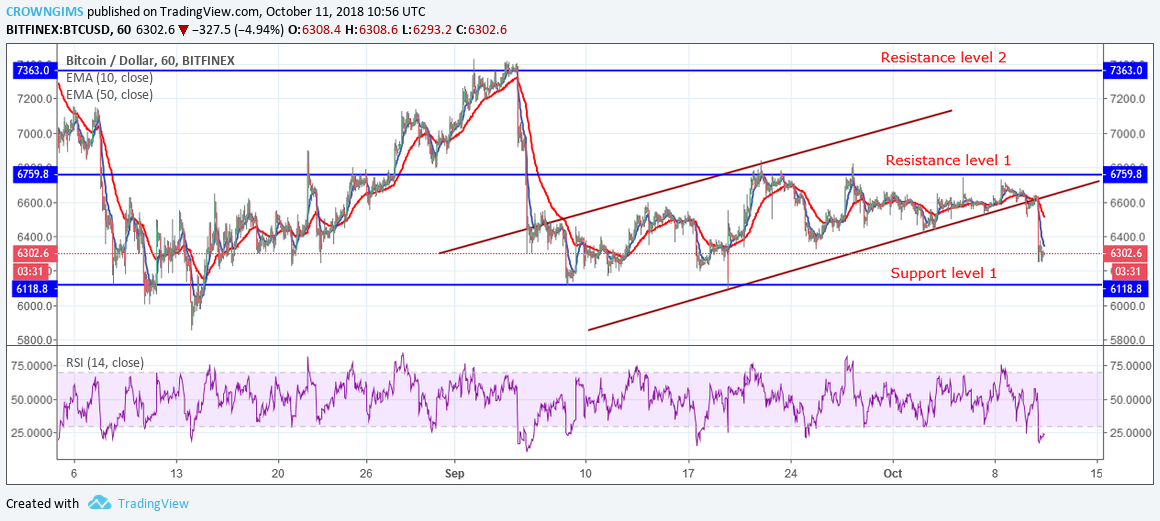
On the 1-hour chart, the BTC price is in a bearish trend. The BTC price is falling towards the low of $6,118 and the price is below 10-day EMA and 50-day EMA. Meanwhile, the Relative Strength Index period 14 is at level 25 which indicates that the market is oversold suggesting bulls may take control of the market.
 Long Positions at All-Time High Yet Price Remains Stagnant")

, and Stellar (XLM) Price Analysis – Recovery Expected Above Major Support Levels")