

XVG/USD
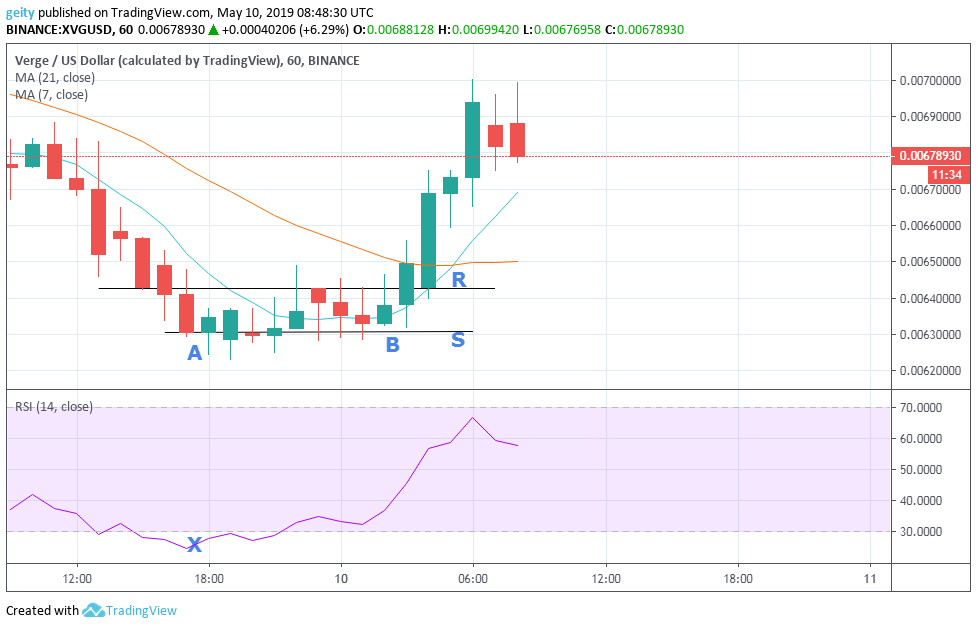
The day began with a bearish outlook. Whereby, traders pushed down the price momentum to close to $0.006302 (A). Later on, the RSI (X) is seen below 30 indicating an oversold market. Lack of momentum in the market is seen between A and B which placed resistance level at $0.006426 and support level at $0.006308. The 7-day MA crossed over the 21 day MA indicating bullish momentum.
Later on, at around 02:00 (B) price breached resistance level and traders pushed the price further up, to a high of $0.0069. XVG started trading at $0.006823 and is currently trading at $0.006926.
FORECAST
During the last few hours, The RSI is heading south; this shows a downtrend in the next few hours. New support level should be set at $0.006970

ZIL/USD
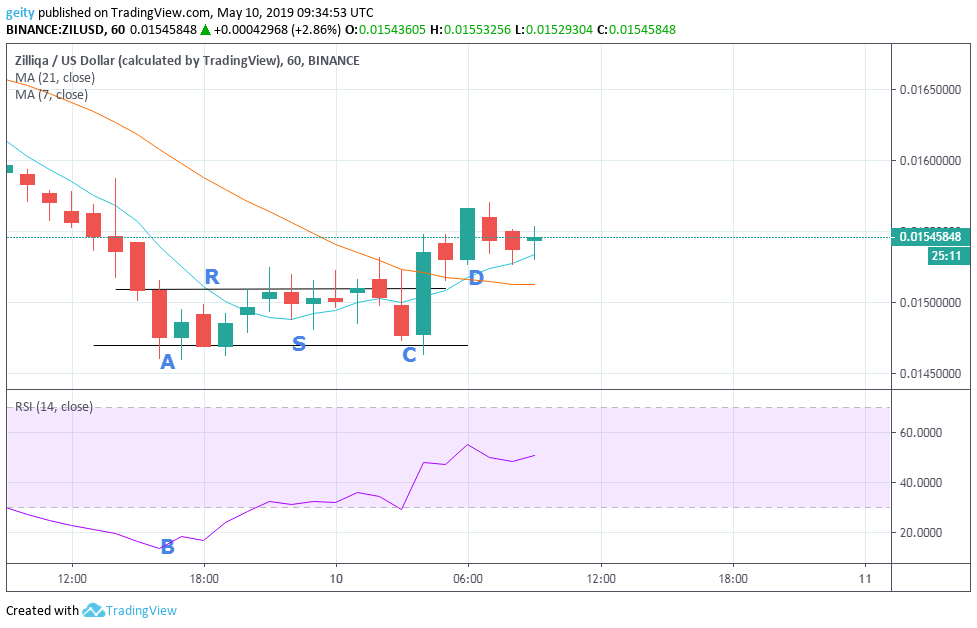
Just like XVGUSD, ZILUSD also started trading with a bearish rally where the price dropped drastically ending up to close at $0.0147 (A), placing resistance level (R) at $0.01509 and support level (S) at 0.01480.
The RSI is seen to be below 30 at point (B) indicating that the momentum of the market at that time was oversold. Later on, Indecision in the market is seen around point A and C thus a sideways price rally. Presence of a horizontal channel confirms the scenario.
At point (D) the 7-day moving average crossed over the 21-day moving average indicating a bullish signal. Price rally was later breached past resistance level to a high of $0.001582.
FORECAST
The RSI is moving in between 60 and 40 thus confirms a sideways trend is likely to be seen in the next few hours. The 7 day MA is above the 21 day MA indicating a bullish signal. New support level should be set at $0.01530.
NANO/USD
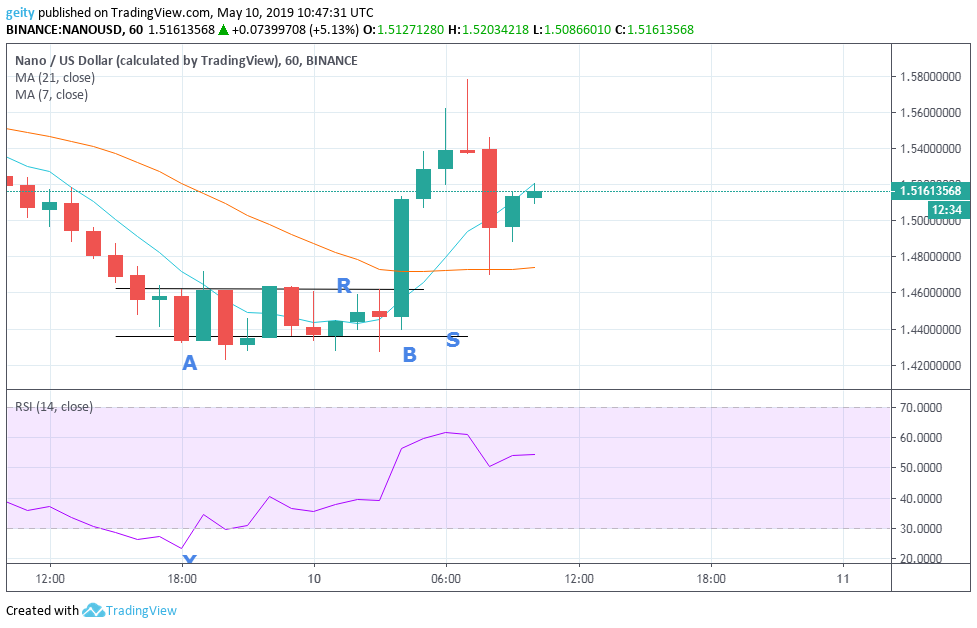
The day began with a bearish outlook, where the price dropped drastically to close at $1.4331(A). This was followed by consolidation of prices, resulting to horizontal channel due to a sideways price momentum (A and B).
The RSI is seen below 30 at (X) indicating oversold market. The resistance level is seen at $1.4625 and support level is seen at $1.4359. Later on, a three inside up candlestick emerged that pushed the price up.
This was followed by the 7-day MA crossing over the 21 day MA indicating a bullish signal and pushed the price further up to a high of $1.5615. Currently, the price of NANO is $1.5161.
FORECAST
The 7-day MA is above the 21-day MA this indicates a bullish momentum in the next few hours. New target should be placed at $1.5967.
 could be among the top 30 coins before the end of the year")

 Price Up 62% From Bottom, Can The Bulls See More Gains?")