

XRP/USD Medium-term Trend: Bearish
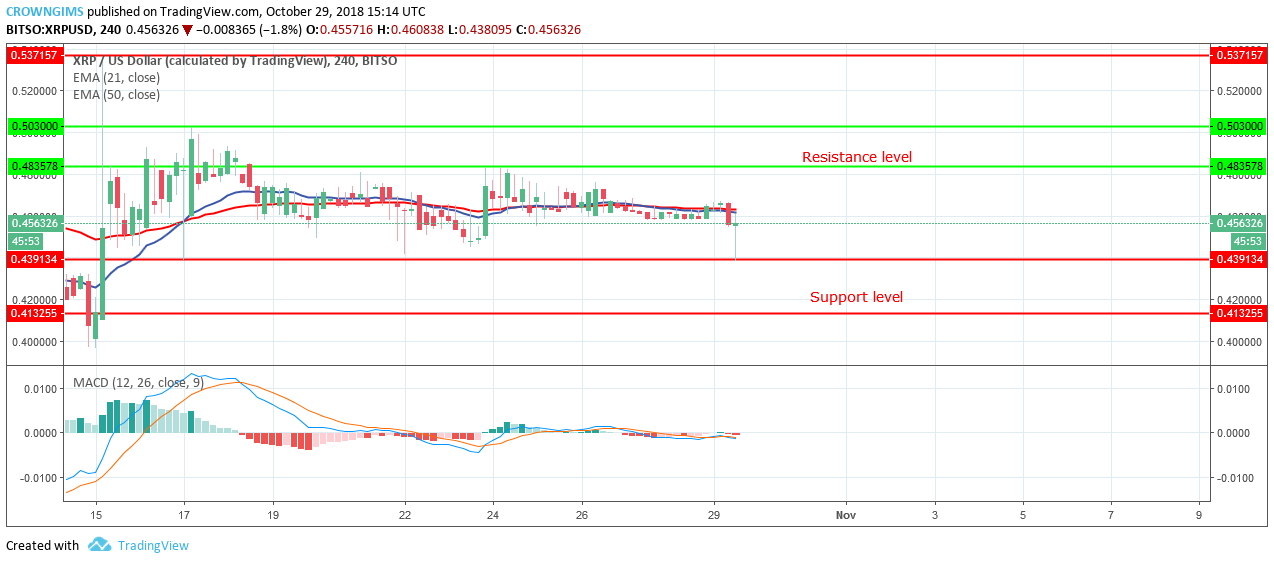
Resistance Levels: $0.48, $0.50, $ 0.57
Support Levels: $0.43, $0.41, $0.40
Yesterday, September 28, XRP price was in a sideways trend. Since after the bearish breakout on October 18 the cryptocurrency had been fluctuating between the levels of $0.48 resistance level and $0.44 support level. Today, the price of the cryptocurrency is falling as it has reached the previous low at $0.43.
Currently, the XRP is experiencing price pullback by the bears and the lower level of price was not broken, that should have been an opportunity to initiate a long trade. Therefore, traders can look out to initiate a long trade at the lower level of price, if the price falls to break the lower level of a price range $0.43.
Nevertheless, the MACD line and the signal line are below the zero line which indicates a sell signal. In the same vein, the XRP price is below the 21-day EMA and the 50-day EMA which indicates that a bearish trend is ongoing.
XRP/USD Short-term Trend: Bearish
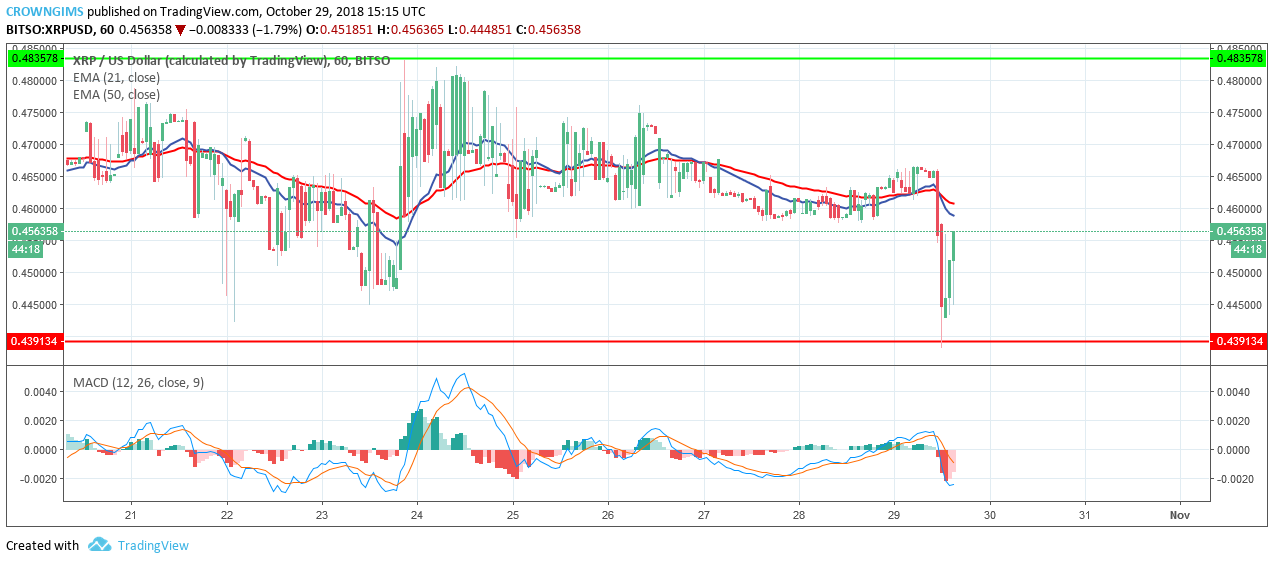
XRP was consolidating yesterday on the 1-Hour chart. Today, the coin was bearish with the formation of strong bearish candles, the coin was moved to the low level of the bound range (support level of $0.43). The bears were unable to break the level, therefore, the bulls took over the market and rally to the north which may be a price retracement.
The 21-day EMA has crossed the 50-day EMA downside and the price is below the 21-day EMA and 50-day EMA which indicates that price is falling. Moreover, the MACD histogram is below the zero line and the signal lines are pointing to the south which indicates a sell signal.

, and Stellar (XLM) Price Analysis – Recovery Expected Above Major Support Levels")
 and Stellar (XLM) Weekly Price Performance Overview")
