
 Technical Analysis #007 -Tron Market Slumps After Independence Day")
Tron has recently gone through an Independence Day where the token migrated away from its previous protocol, Ethereum, to create it’s own blockchain and protocol. The migration process has officially finished but the markets have not responded favourably in the short term.
Over the past 24 hours, at the time of writing, TRX has dropped a total of 6% as it trades at its current price of $0.03. This is down by 18% over the past 7 trading days and a total of 38% over the past 30 trading days.
Tron currently sits at rank 10th in terms of overall market cap with a total value of $2.62 billion. This is down over half a billion dollars from $3.2 billion seen last week on June 21st. However, it is important to note that markets are still down across the entire market so this price drop is not just related to Tron.
Let us analyse price action over the recent period.
Price Analysis
TRX/USD – SHORT TERM – DAILY CHARTS
https://www.tradingview.com/x/R4taTsik/
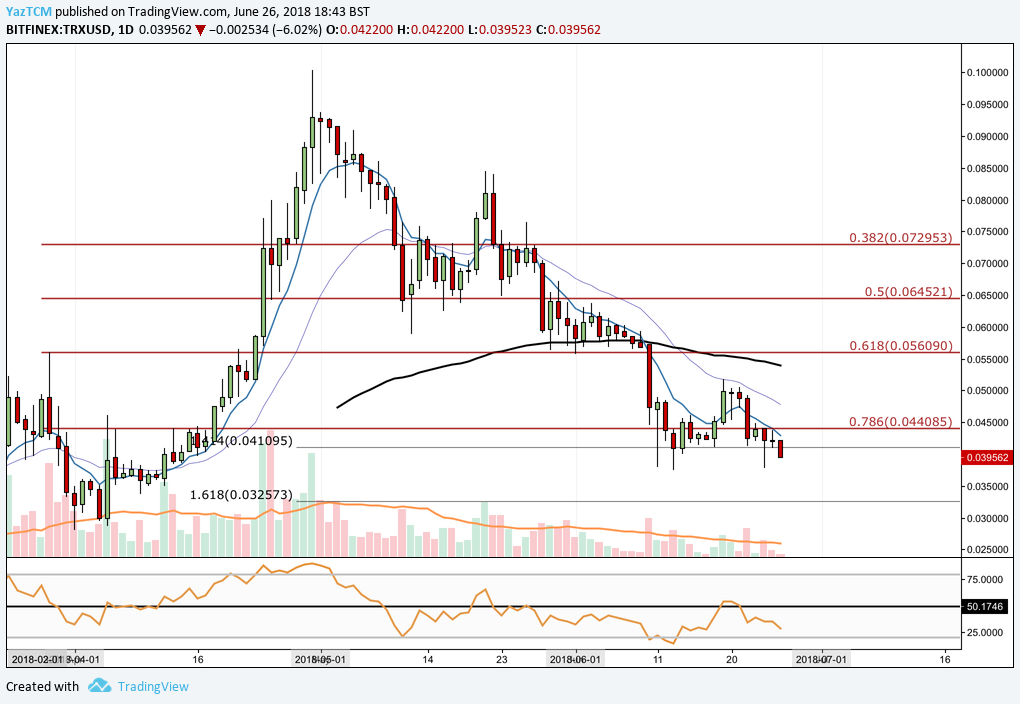
Looking at the chart above, we can see that TRX has fallen past the .786 Fibonacci Retracement, taken from the bullish run seen during April, at a price of $0.44. Price action penetrated beneath this level and found support at the 1.414 Fibonacci Extension at a price of $0.041. This is an extension taken from the initial bearish leg experience during May.
Price action is currently involved in a battle to stay above the long term 1.414 Fibonacci Extension. If the bulls can manage to hold above this level and eventually break above the .786 Fibonacci Retracement then the bullish momentum may take the market in to near term resistance at the .618 Fibonacci Retracement priced at $0.05.
Alternatively, if price action continues lower, the nearest level of long term support can be found at the 1.618 Fibonacci Extension priced at $0.032.
The technical indicators are largely favouring the bears in this market. The RSI is trading well below the 50 handle and looks to be heading toward oversold conditions. For a sign that the bears are starting to lose momentum within the market we will look for RSI to make its way back toward and eventually break above the 50 handle.
Let us analyse price action over the more recent period a little closer.
TRX/USD – SHORT TERM – 4 HOUR CHART
https://www.tradingview.com/x/e5zk8aFp/
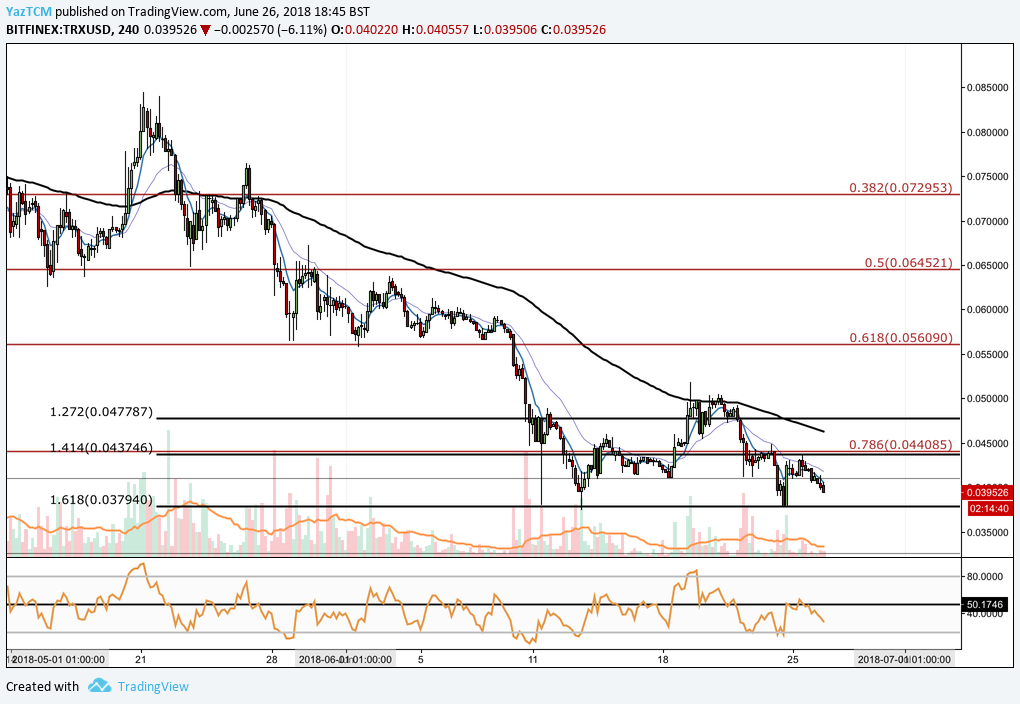
Looking at price action a little closer, we can see that the market had found support on the short term 1.618 Fibonacci Extension (marked by the thick black line) at a price of $0.0378 before rebounding back toward the long term .786 Fibonacci Retracement. This is a Fibonacci Extension taken from the high seen on the 20th of May to the low seen on the 29th of May.
If price action continues lower in the short term, we could expect immediate support to be found at this 1.618 Fibonacci Extension level.
Let us analyse how price action has been reacting against BTC in the recent term.
TRX/BTC – SHORT TERM – DAILY CHART
https://www.tradingview.com/x/JJZ9b39F/
Analysing TRX against BTC, we can see that the market had experienced a bullish run during April as price action rose from a low of 437 SATS to a high of 1078 SATS, an incredible 140% price increase.
Since this all time high, price action, along with volume, has dwindled and fallen past the .618 Fibonacci Retracement at a price of 683 SATS. This is a Fibonacci Retracement taken from the bullish run seen during April.
Price action is currently trading at 641 SATS, breaking below the .618 Fibonacci Retracement after Independence Day. We can see that two weeks ago price action had found support at a 1.272 Fibonacci Extension priced at 627 SATS. This is a Fibonacci Extension taken from the initial bearish leg seen after the all time high in May.
If the market continues lower, we could expect support to be found at the 1.272 Fibonacci Extension. Further support following this is at the .786 Fibonacci Retracement level priced at 576 SATS.
Conclusion
The market has not responded particularly great for Tron holders after Independence Day. However, it is important to know that Independence Day was not intended to be a huge market moving day as trading volume would typically dry down during a token migration. Instead, Independence Day can be viewed as a starting catalyst for the bright future ahead for Tron.

