
 Technical Analysis #004 - Will Tron Break above the current range it is trapped within_")
Tron, the digital currency spearheaded by Justin Sun, has found some significant support at a major Fibonacci level following the release of its main net protocol.
The Fibonacci Retracement mentioned is a .618 Fibonacci Retracement of the bullish run seen in April. The .618 is said to be the ‘Golden Ratio’ within technical trading and is considered to hold a significant level of support.
The support level is also bolstered by the incoming wave of support shown toward the Tronix token. Shortly after launch, the Tronix team announced that they will be partnering with the Indonesian crypto exchange ‘Indodax’, allowing native traders to trade the Rupiah.
We will be closely monitoring price over the coming weeks as the token migration edges closer for the TRX token on June 25th
TRX/USD Price Analysis
TRX/USD – Daily Chart –
https://www.tradingview.com/x/7MieoCM0/
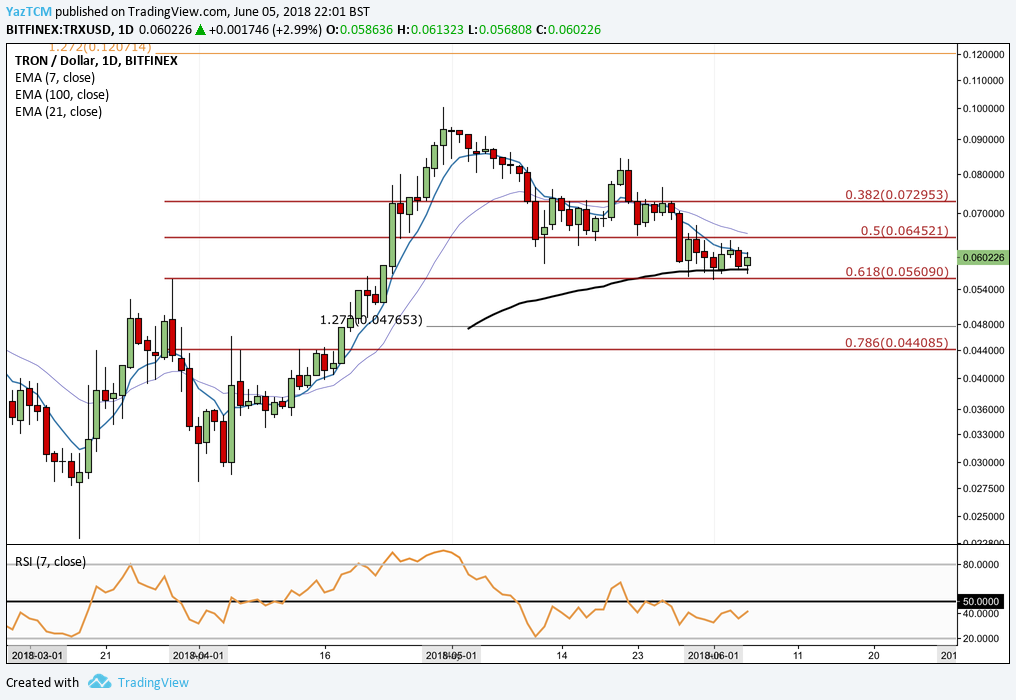
From the daily chart above, we can see that over the course of the past week Tronix has managed to stay above the .618 Fibonacci Retracement marked at $0.056. This Retracement has been covered in our previous Tron articles here. The price level of $0.056 has proven to hold as price action currently floats between a range of the .618 Fibonacci Retracement at $0.056 and the .50 Fibonacci Retracement at $0.064.
We expect price to remain trading predominantly within a range-bound condition in the lead up to the TRX token migration, where all TRX ERC-20 tokens will be transferred in to TRX main net tokens. The .618 Fibonacci Retracement has proven its validity and we expect it to hold over the coming weeks.
Price action may gain some momentum and break above the .50 Retracement level, in this scenario we could expect price to head on up toward previous resistance marked at $0.072 before going on to test the all time highs.
The technical indicators have recently been floating just below he 50 handle, showing the weak bearish momentum within the market. Are the bulls ready to pick up the speed? For the bulls to gain some momentum we would need to see RSI make its way up above 50.
TRX/USD – 4 Hour Chart –
https://www.tradingview.com/x/Udm9Kl9w/
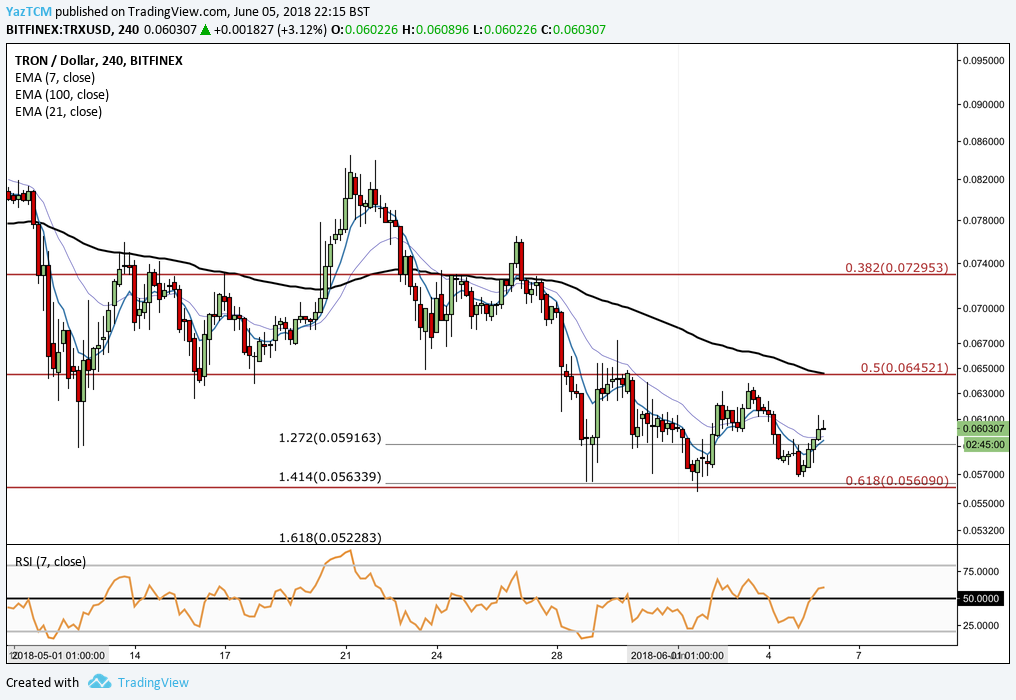
From the short term perspective, we can see how price action found its support directly above the .618 Fibonacci Retracement at a price of $0.057 which is proving to be a very strong support area.
Price action is looking increasingly bullish in the short term. Looking at the technical indicators we can see that RSI has managed to bully its way across the 50 level. It will be important to see if RSI can stay above 50 over the next few trading sessions. The 7-day EMA and the 21-day EMA are also poised to cross above one another which would further aid to the bullish momentum growing within the market.
If price action can continue along this growing bullish trajectory then we could expect June to provide some strong gains for TRX against the USD. Price action would first have to climb and close above resistance at $0.064 for this bullish month to be possible.
A Quick Look At BTC/TRX
TRX/BTC – Daily Chart –
https://www.tradingview.com/x/VBjQE9AX/
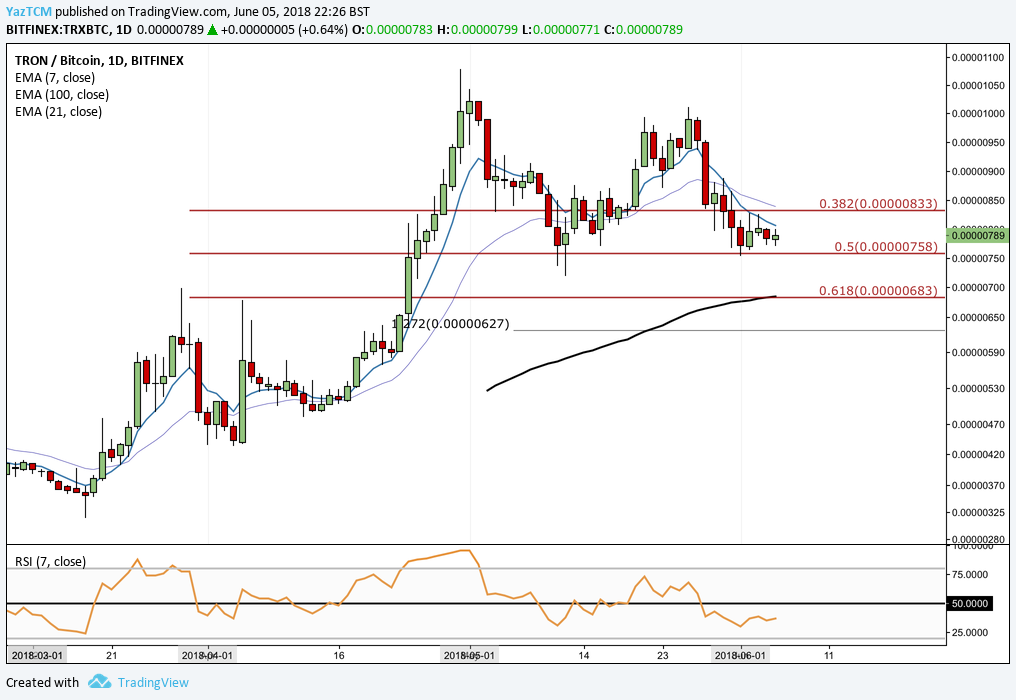
We can see that TRX has conned to return some of the gains experienced during the small bullish run experienced during the second half of May. TRX is currently trading at a price of 789 SATS against BTC.
We can see that Tron has retraced further to the .50 Fibonacci Retracement level at a price of 758 SATS. However, this Retracement level have proven to hold as support during recent trading sessions, so we do not expect prices to head lower. However, if they do, we could a deeper retracement as price action heads toward the .618 Fibonacci Retracement at 683 SATS.
The technical indicators are aiding to the bearish case within the market. We can see that RSI has been consistently below 50 over the most recent sessions and the 7-day EMA and 21-day EMA have crossed below one another indicating positive bearish momentum within the market.
With the official token migration occurring toward the end of this month, can the bulls hold price action above the ranges identified against both BTC and the USD?

