
 Technical Analysis- Continues it’s ascension against BTC whilst consolidating against the USD")
Tronix, the underlying fuel and digital currency of the Tron platform, has continued in its battle against BTC. The TRX token experienced some small gains yesterday despite the recent bearish action within BTC.
With the imminent release of Tron’s MainNet due at the end of the month, it is important to be ready of how the markets may react to the release.
Long Term Overview
As Tron is a relatively young in its development as a project it is difficult to give a detailed technical analysis outlook in the long term. However, it is possible to mention that despite BTC’s recent bearish momentum, Tron has remained relatively firm in holding its value against BTC.
TRX/BTC
https://www.tradingview.com/x/wb2MSHkA/
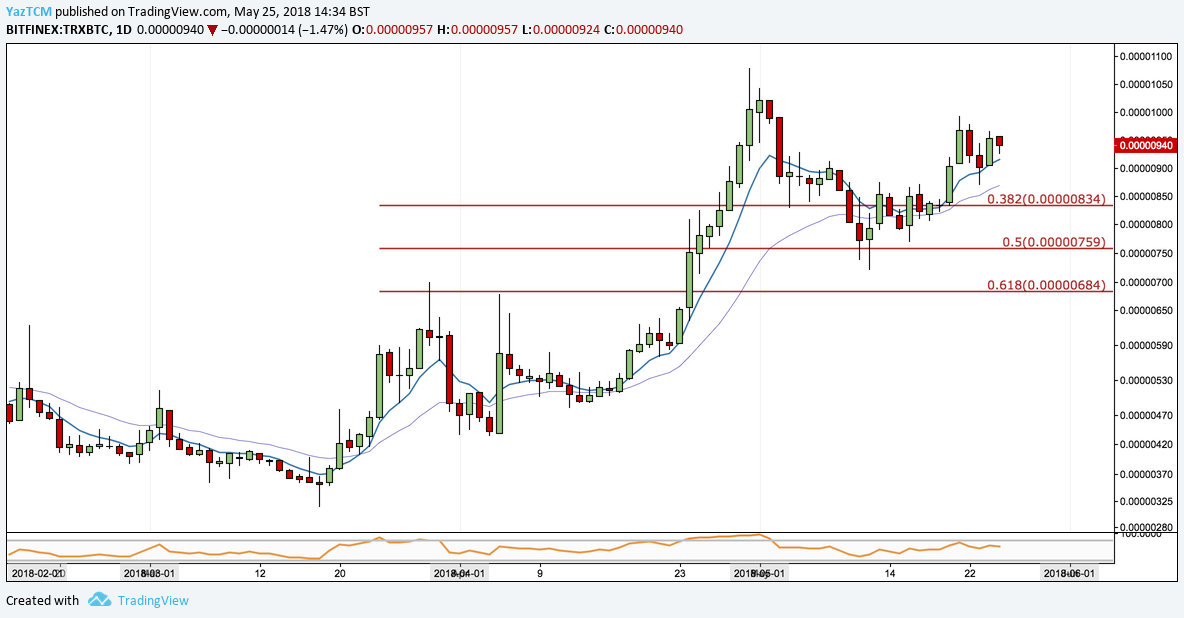
Tron experienced an incredible month against BTC in the month of April, rising from a low of 436 SATS (Satoshis) to a high of 1080 SATS, according to data from BitFinex. This incredible bullish run, an approximate 140% increase, has shown signs of remarkable stability in the month of May. We can see that price action retraced up to the .50 Fibonacci Retracement level, at a price of 759 SATS, during the first half of the month, before continuing another bullish run during the final half of the month.
With the MainNet launch looming, we will be closely following the progression of the TRX token against BTC. If TRX/BTC can break and close above the all time high (ATH) set late last month at 1080 SATS, then we will expect the token to continue its bullish rally into the 1240 SATS region.
TRX/USD
https://www.tradingview.com/x/gLSYFAUI/
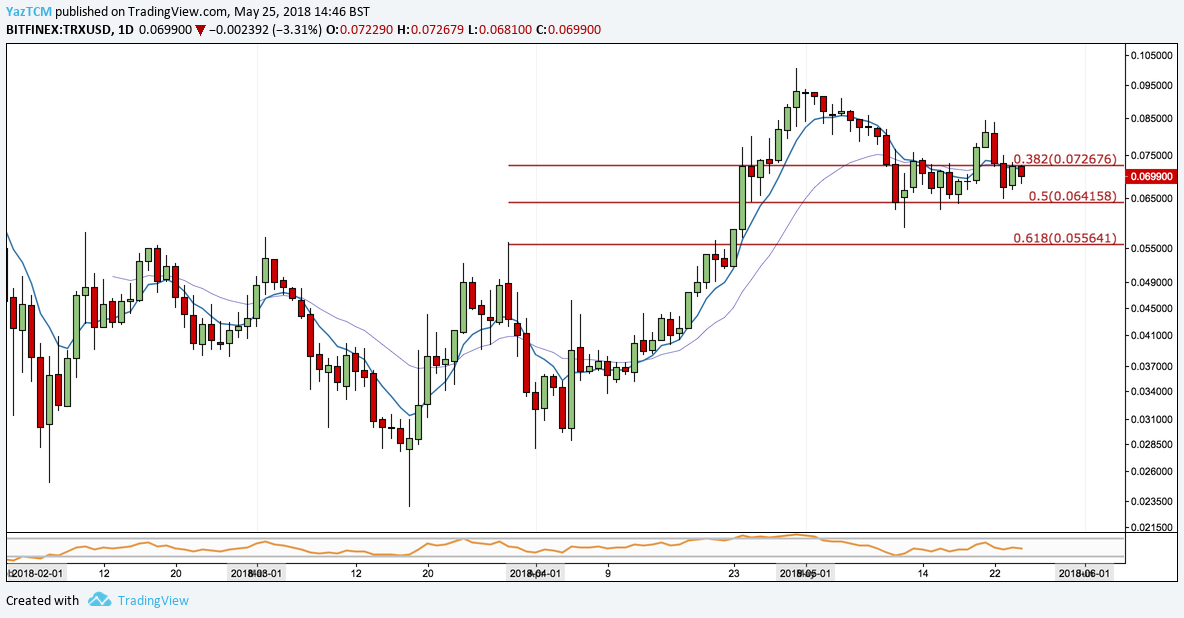
TRX also experienced a great month, in April, against the USD. The TRX/USD was trading at $0.0281 on the 1st of April before its significant rise to to its all time high (ATH) of $0.10 set on the 29th of April.
During the first two weeks of May we can see that TRX/USD had retraced up to the .50 Fibonacci Retracement level, at a price of $0.064, where it has garnered some significant support. The pair is currently in a consolidation trading condition ranging between $0.0587 and $0.0843.
With BTCs recent bearish action it will be difficult for TRX to continue to make gains against the USD if BTC keeps falling. However, if TRX can continue appreciating in its run against BTC then we could expect the market to make a new ATH.
If TRX manages to break and close above $0.10 dollars then we will be expecting price to continue to rally into the the $0.12 -$0.14 region. This is based off a Fibonacci Extension taken from the significant bullish rally seen in April.
Short Term Overview
TRX/BTC
https://www.tradingview.com/x/uOCkFIqw/
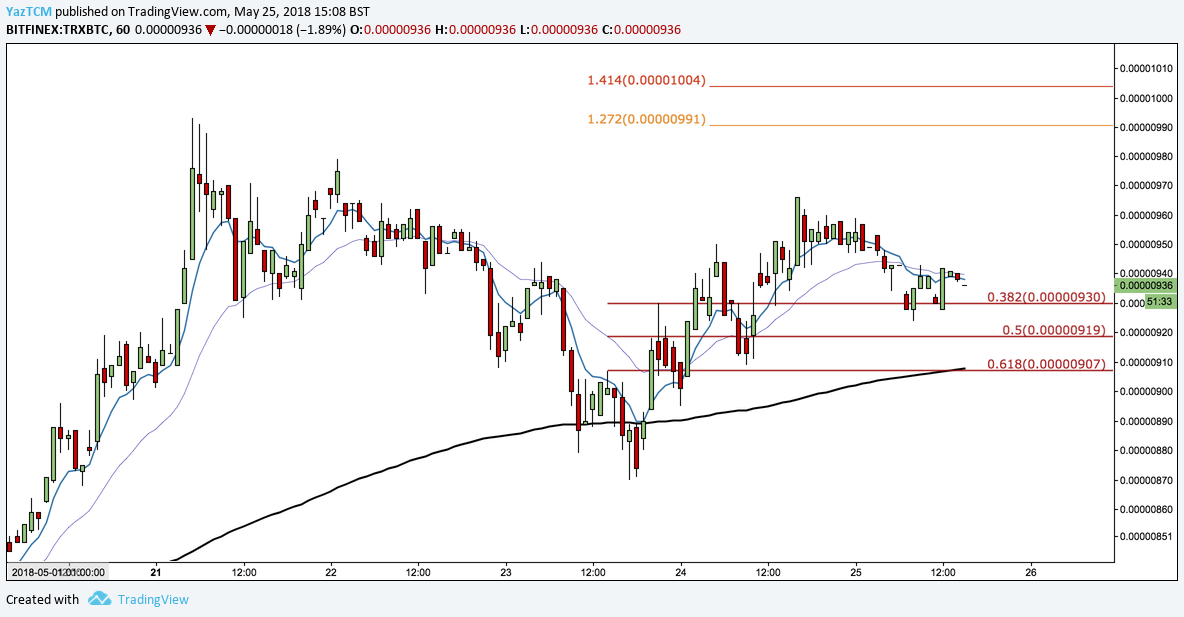
On the shorter time frames Tron is in a period of indecision as it attempts to make higher highs. We can see that the market is trading sideways as the market waits to make the next move.
The market has made a slight retracement of the gains seen over the past day, hitting the .382 Fibonacci Retracement level, at a price of 930 SATS. If the market manages to break and close above the 966 SATS handle we can expect a rally into the 991 SATS area. Alternatively, if the market continues on it’s slightly bearish trajectory we could expect a deeper retracement, possibly into the .618 Fib Retracement at 907SATS.
TRX/USD
https://www.tradingview.com/x/IB3MyLMb/
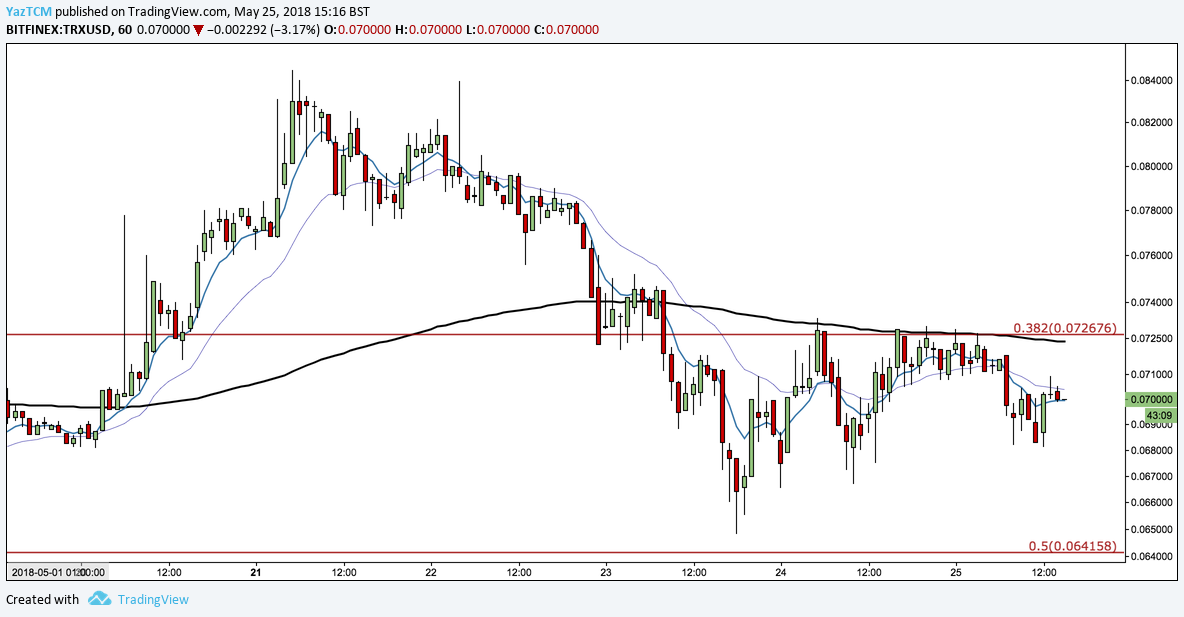
Currently, the TRX/USD pair is also trading sideways as traders all wait for the market to make its next move.
We can see that price action is experiencing slight resistance at the long term .382 Fibonacci Retracement level, around $0.0726. If price action manages to overcome and close above this resistance zone then we will expect price to make another attempt at the most recent high of around $0.084. Furthermore, if price continues to break and close above the recent high then we can expect price action to head toward the $0.090 mark.
Alternatively, if price fails to break the long term .382 Fib Retracement of $0.072 then we may see some more downside movement heading toward the .60 Fib Retracement level of $0.064.

