XLM/USD Price Long-term Trend: Ranging

Resistance levels: $0.14, $0.16, $0.18
Support level: $0.12, $0.09, $0.07,
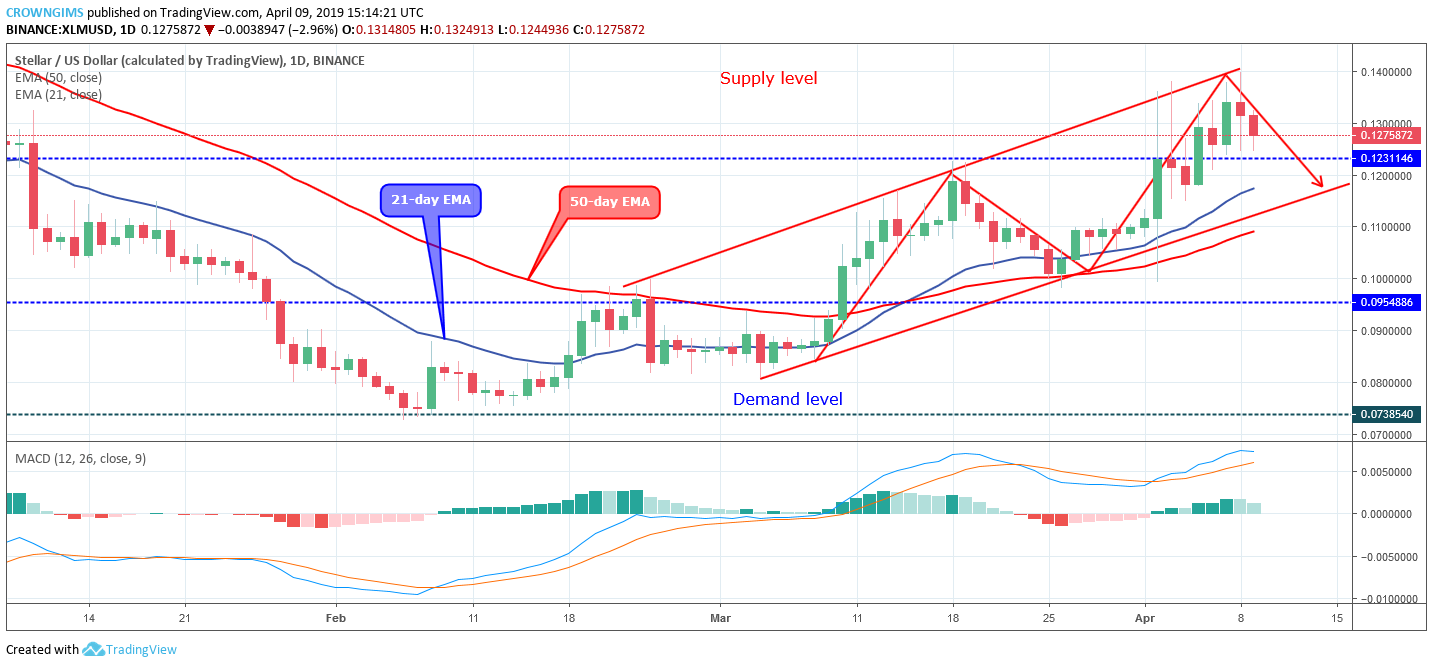
The XLM price is ranging in the medium term. XLM was bearish for long days after which the Bulls made an attempt to break up the $0.09 price level on February 23 but resisted at the level. The coin started consolidation for two weeks before March 9. The Bulls gained enough pressure and propelled the XLM price towards $0.12 price level.
The Bulls momentum was lost and the Bears pushed down the coin towards the low level of $0.095, the coin had its support at the dynamic support level of 50 periods EMA. Currently, the Bulls have placed XLM price above $0.12 support level. The XLM price movement on the daily chart has led to the formation of a rising channel pattern.
XLM price is trading above the 21 periods EMA and 50 periods EMA and the coin is at a distance to the two EMAs. The MACD period 12 have its histogram above the zero level and the signal lines above zero level pointing down to indicate sell signal. The XLM price has touched the upper trend line of the rising channel and the price bounced facing the lower trend line. There is a tendency that XLM price will touch the lower trend line at $0.12 price level
XLM/USD Price Medium-term Trend: Bullish

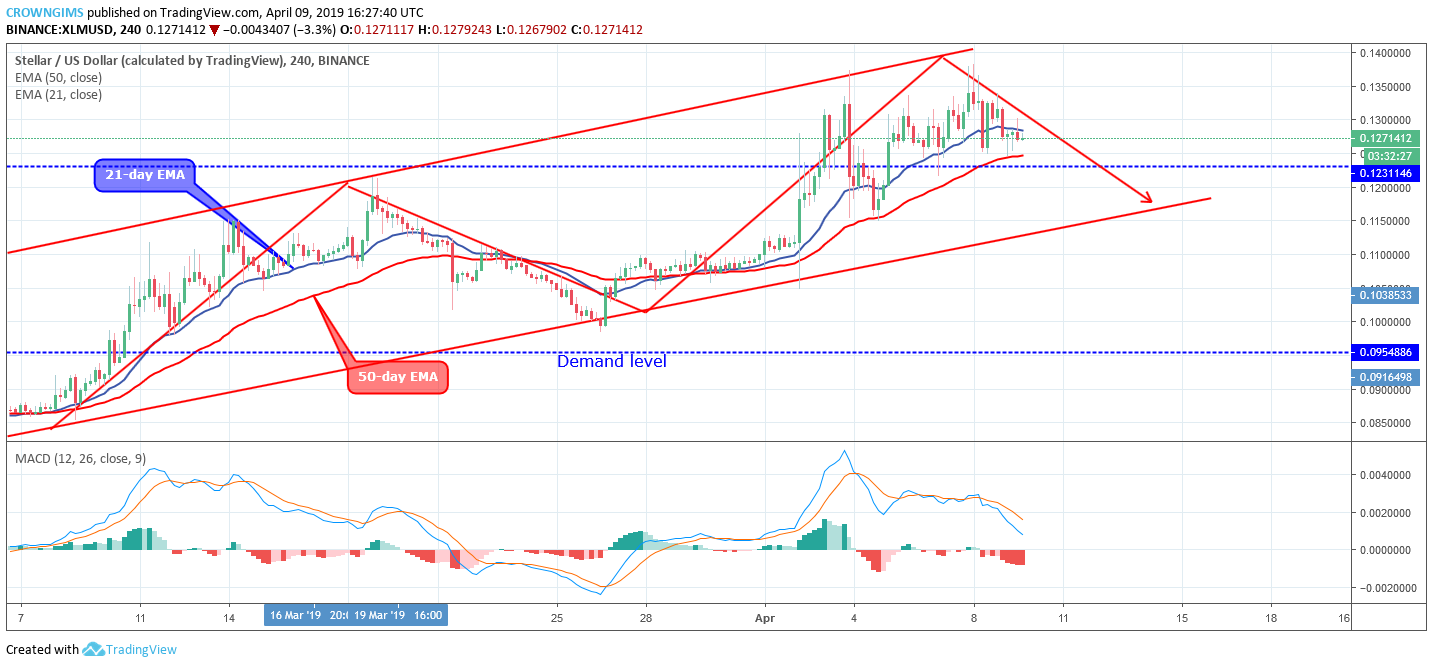
On the medium-term trend, the XLM price is bullish. The bullish movement of the coin in the 4-hour chart has resulted in the formation of a rising channel in which the coin is touching the upper trend line and bounced to touch lower trend line with an increase in price. The coin is currently moving sideways above the $0.12 price level.
XLM is trading in between the 21 period EMA and 50 period EMA, making attempt to cross below the 50 period EMA. The signal lines of the MACD period 12 are above zero level bending down and its histogram is also below zero level to indicate sell signal. There is probability for the coin to pull back and place the coin below the $0.12 price level to touch the lower trend line.


