
 Price Analysis November 2")
XLM/USD Price Medium-term Trend: Bearish
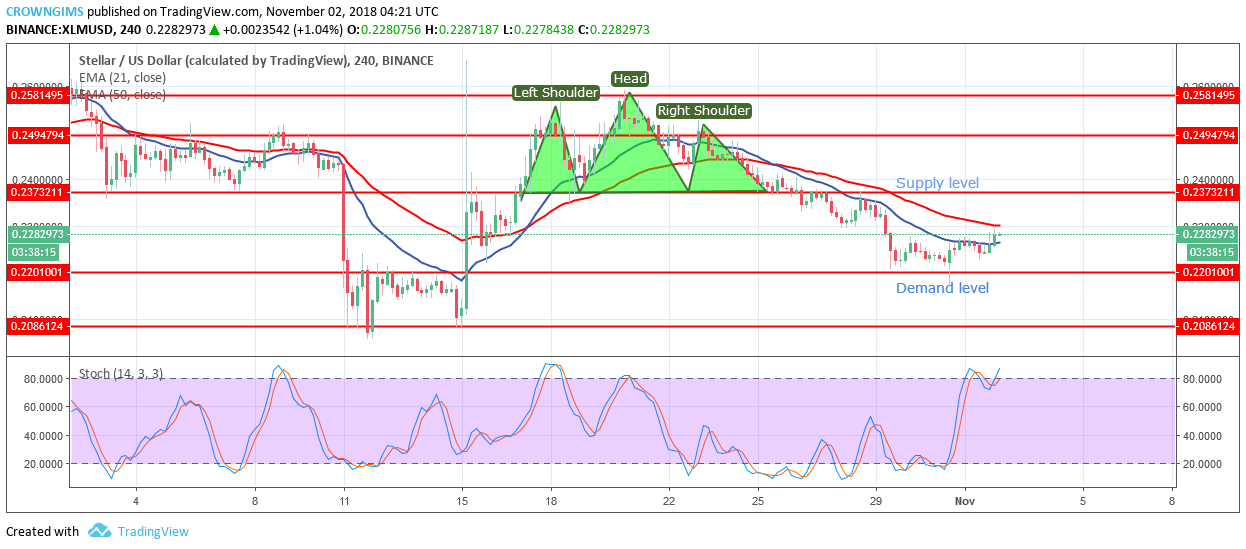
Supply levels: $0.23, $0.24, $0.25
Demand level: $0.22, $0.20, $0.16
Stellar continues its bearish trend on the 4-Hour chart.
A week ago, XLM formed Head and shoulder pattern in which the neckline was the supply level of $0.23. The right shoulder completed on October 25 at the supply level of $0.23. As the bears still hold tight to the control of the XLM market, the price dropped from there to the demand level of $0.22 then started consolidation.
XLM price is presently between the 21-day EMA and the 50-day EMA. The 21-day EMA has crossed the 50-day EMA downside; this suggests gradually coming off the bulls into the market. The RSI 14 is above 70levels with signal lines pointing to the north which indicate buying signal.
In case the bulls succeed in pushing the price towards the supply level of $0.23 and break it open to the upside, then, XLM will commence its uptrend movement in which supply level of $0.24 will be the first target.
XLM/USD Price short-term Trend: Bearish
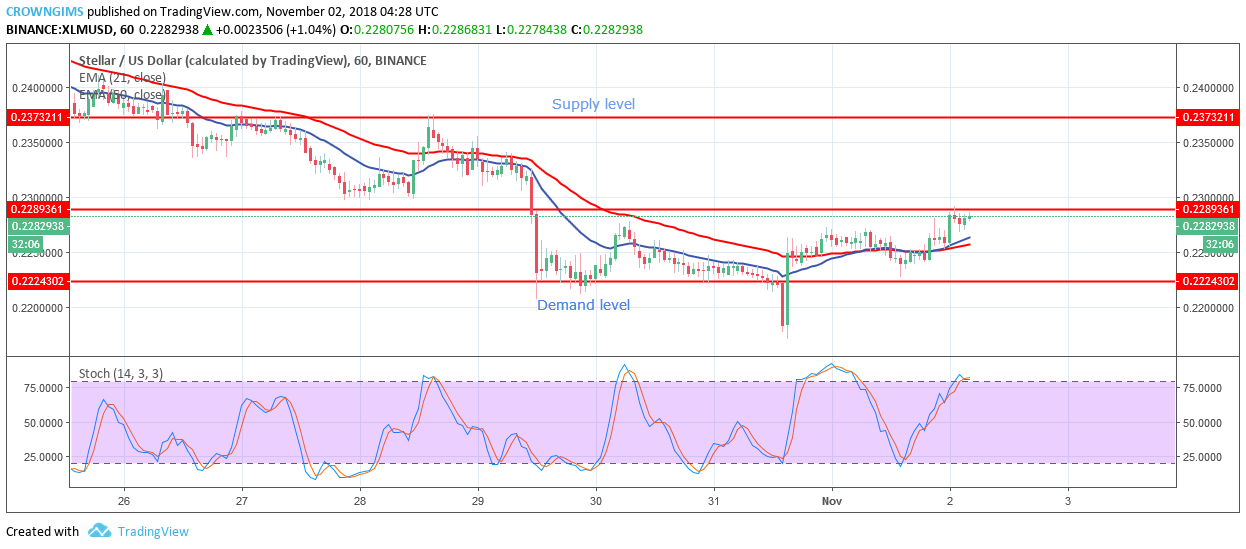 Stella continues its bearish trend on 1-Hour chart. Formation of a bullish engulfing candle on October 31 prevents a further decrease in XLM price and it brought about an increase in price above the demand level of $0.22.

Today, the price is above the demand level of $0.22. Should the demand level of $0.22 holds and the bulls increase their momentum the price will continue rally to the north and the trend may change to an uptrend.
XLM is above 21-day EMA and 50-day EMA. The two EMAs were separated from each other which indicate uptrend is ongoing.


