

XLM/USD Price Medium-term Trend: Ranging
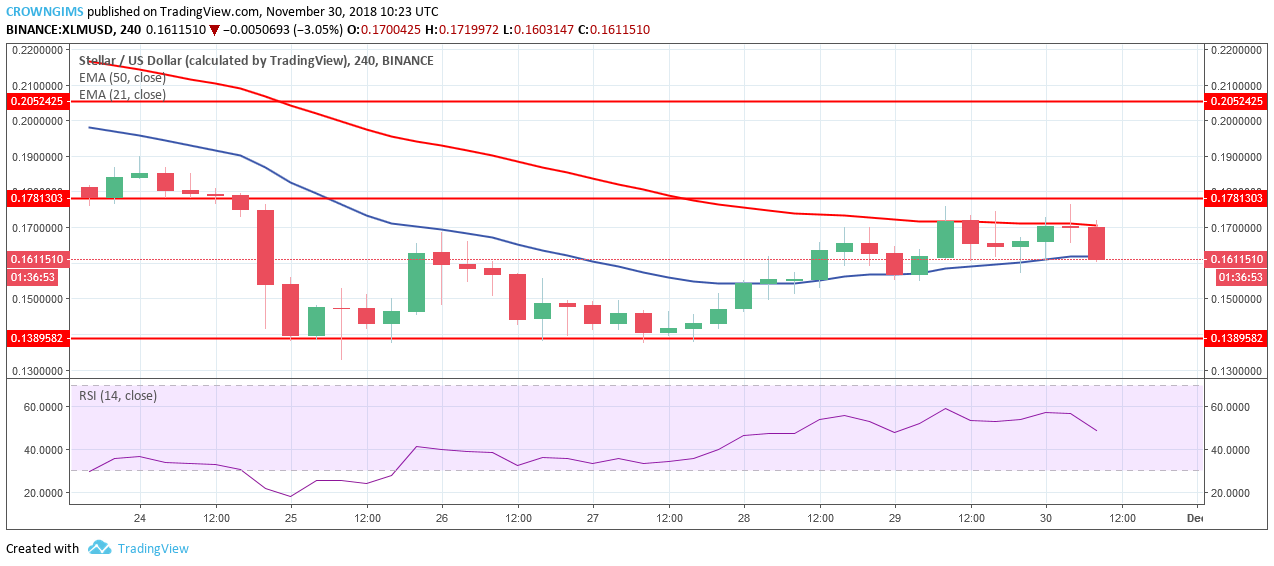
Resistance levels: $0.17, $0.20, $0.22
Support level: $0.13, $0.10, $0.09,
The XLM price is ranging on the medium term. Stellar has been range-bound for more than four days between the resistance level of $0.17 and the support level of $0.13. The XLM rallied around the supportive level of $0.13 where the breakout to the south was prevented by the bulls and the XLM price was pushed up and broke the dynamic resistance level 21-day EMA but unable to penetrate the 50-day EMA and then the price stays within the two EMAs.
As long as XLM price remains between the two EMAs ranging movement remains. However, the Relative Strength Index (RSI) is below 60 levels pointing to the south which indicate a sell signal. Should there be breach below $0.13 support level with a strong bearish candle, traders may place sell setup to have their take profit at $0.10 support level. In case of rejection at $0.13 price level, the price may pull back before it continues the bearish trend.

XLM/USD Price short-term Trend: Bearish
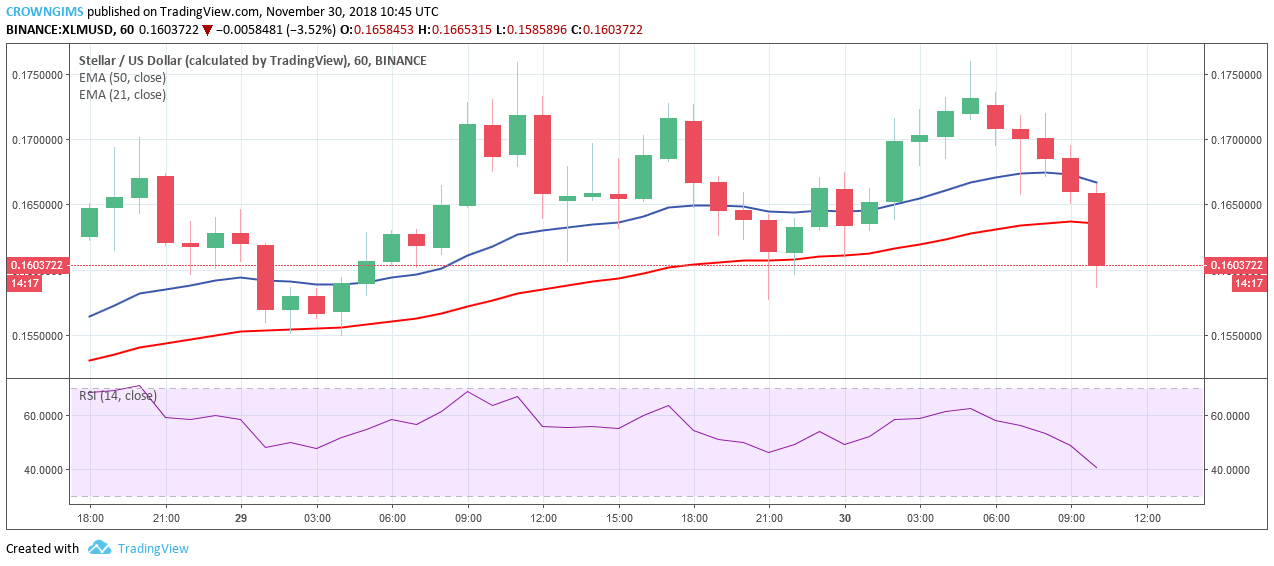
On the short term trend, the XLM price is bearish. The bullish inside bar candle formed at the opening of today’s market signaled the increased momentum of the bulls which pushed the coin up to the $0.17 resistance level. The bulls lost pressure and could not push the coin to penetrate the level and inverted hammer candle formed which indicate the pressure from the bears and the price started to decline with the formation of bearish candles.
As a moment, the price is crossing below 50-day EMA while 21-day EMA is about to cross it downside and RSI at 40 level bending down which indicate strong selling signal.
 Price Up 62% From Bottom, Can The Bulls See More Gains?")

