
 Price Analysis October 8 2018, Serious Bull Bear Battle")
XRP/USD Medium-term Trend: Bearish
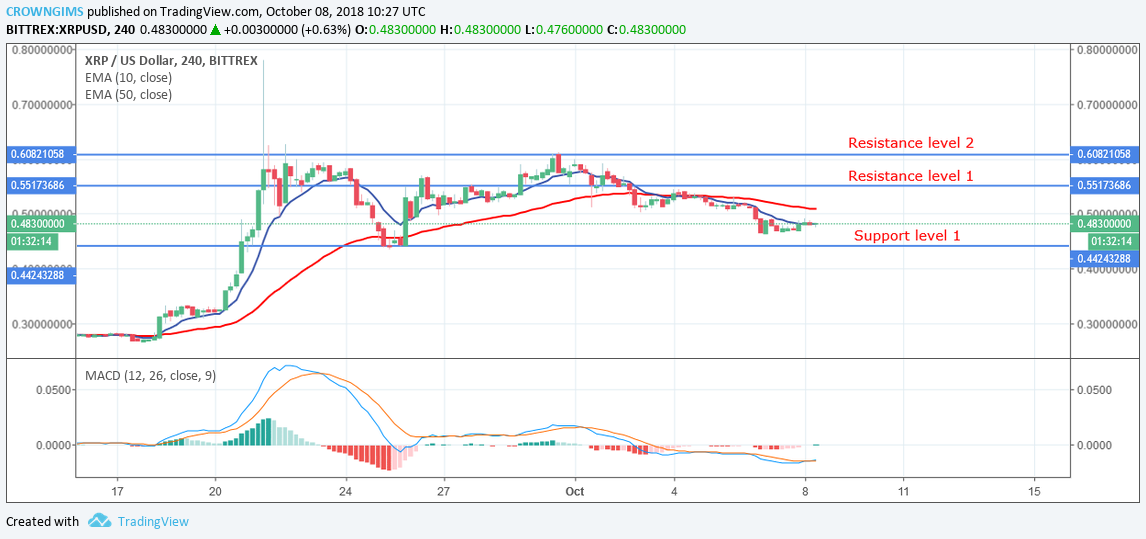
Resistance Levels: $0.55, $0.60, $ 0.70
Support Levels: $0.44, $0.33, $0.22
Yesterday, October 7, XRP price was in a bearish trend. Since after the bearish breakout that broke the resistance level of $0.55 downward, the cryptocurrency had been trading between the resistance level of $0.55 and the support level of $0.44.
Today, the price of the cryptocurrency is falling with low momentum as the price approaches the previous support level of $0.44. In case the price falls to the low of $0.44 and the support level holds, traders should look out for buy setups to initiate long trades.
In other words, should seller increase their momentum and the price break the support level of $0.44 downside, the price will be exposed to the lower support level of $0.33, then the traders can take the short trade.
Nevertheless, the MACD line and its signal line are above the zero line which indicates a buy signal. In the same vein, the XRP price is in between the 10-day EMA and the 50-day EMA which indicates that bulls may take control of the market.
XRP/USD Short-term Trend: Bearish
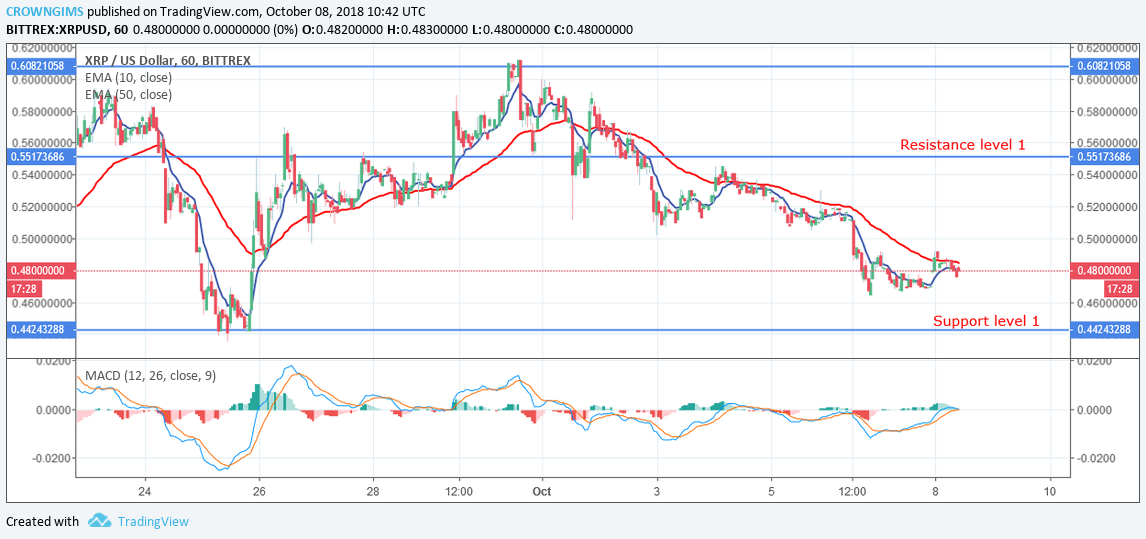
On the 1-hour chart, the XRP price is in a bearish trend. The XRP broke the resistance level of $0.55 downward and the price was pushed to the support level of $0.44, it was rejected by the increased force of the buyers confirmed by the formation of the bullish engulfing candle which pushed the price towards dynamic resistance of 10-day EMA.
As at present the price is below 10-day EMA and the 50-day EMA which indicates that price is falling. Also, the MACD histogram is above the zero line and the signal lines are pointing to the south indicates a sell signal. In case the price falls to the low of $0.44 the support levels may be breached.
, and Stellar (XLM) Price Analysis – Recovery Expected Above Major Support Levels")
 and Stellar (XLM) Weekly Price Performance Overview")
